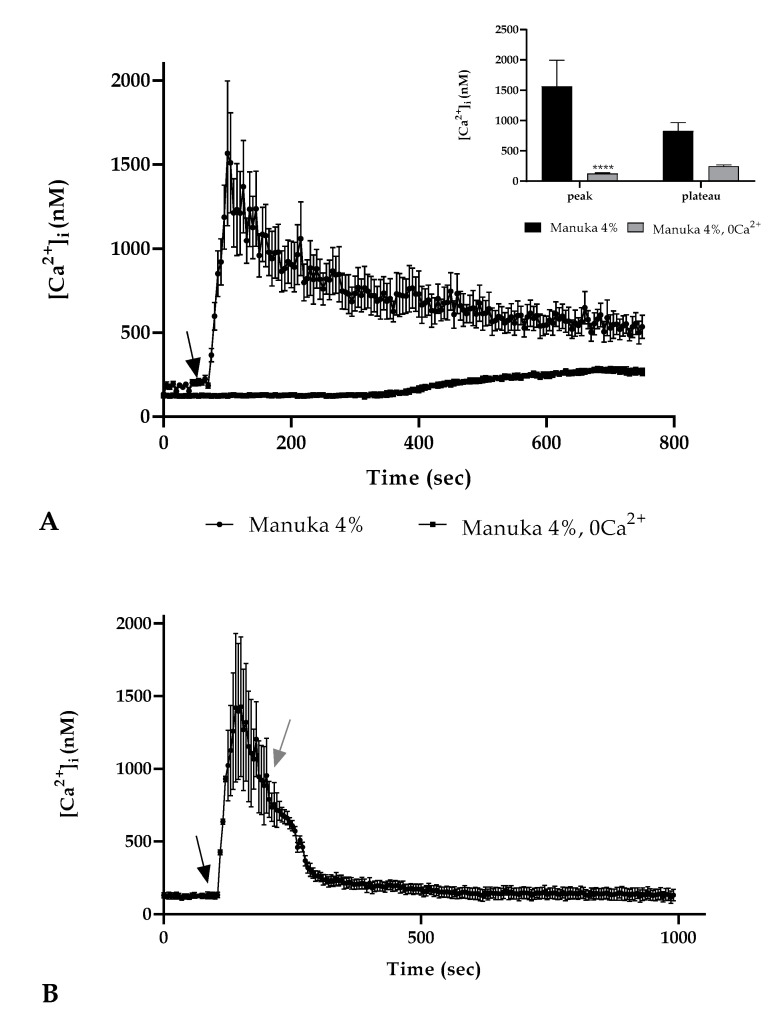
Figure 3.
The Ca2+ response to honey involved extracellular Ca2+ entry. (A) The Ca2+ signaling due to 4% manuka honey exposure was eliminated in a 0 Ca2+ condition. The arrow shows the honey addition after 60 s. Data are expressed as mean ± SEM of [Ca2+]i traces documented in different cells. Number of cells: manuka honey 0 Ca2+: 30 cells from 3 exp; manuka honey: 40 cells from 3 exp; Insert. Mean ± SEM of the peak Ca2+ response measured under the chosen treatments. Number of cells as in (A) Asterisks on bars indicate the statistical differences determined by two-way ANOVA followed by Bonferroni correction (**** p < 0.0001). (B) A431 cells have been stimulated with 4% manuka honey in the presence then in the absence of external Ca2+ (0 Ca2+). When Ca2+ was removed from the medium there was a [Ca2+]i decrease. The black arrow indicates the addition of honey after 60 s; the gray arrow the removal of extracellular Ca2+. Data are expressed as mean ± SEM of [Ca2+]i traces documented in 40 diverse cells from 3 exp.

