Figure 5.
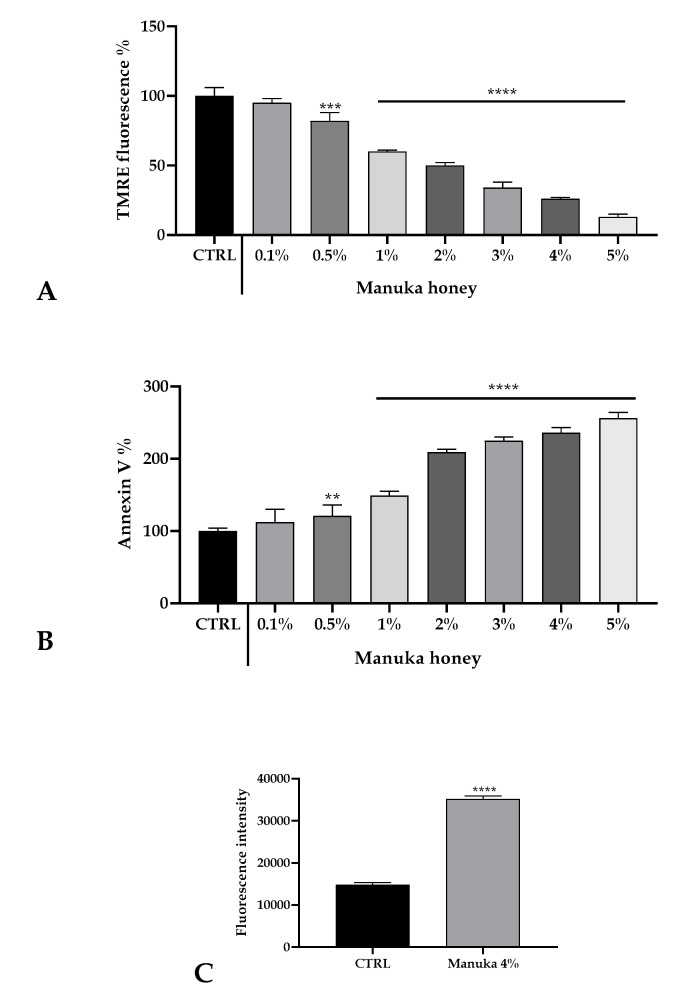
Honey induced cell death of A431 cells. (A) TMRE fluorescence evaluated in A431 cells treated for 3 h with varying concentrations of manuka honey. Data are expressed as mean ± SD obtained from 10 independent treatments and indicated as fluorescence %. Asterisks on bars indicate statistically significant differences assessed by one-way ANOVA followed by a Dunnet post-test (** p < 0.01, **** p < 0.0001). (B) Annexin V-FITC fluorescence in A431 cells treated with honey as above. Data are mean ± SD obtained from 10 independent treatments and expressed as fluorescence %. Statistics as in A (*** p < 0.001, **** p < 0.0001). (C). Fluorescence values recorded after 45 min incubation with 4% manuka honey. Data are indicated as mean ± SD of DHR-123 fluorescence measured in arbitrary units; n = 16 microplate wells from two experiments. Different asterisks on bars specify statistical differences determined by a t-test (**** p < 0.0001).

