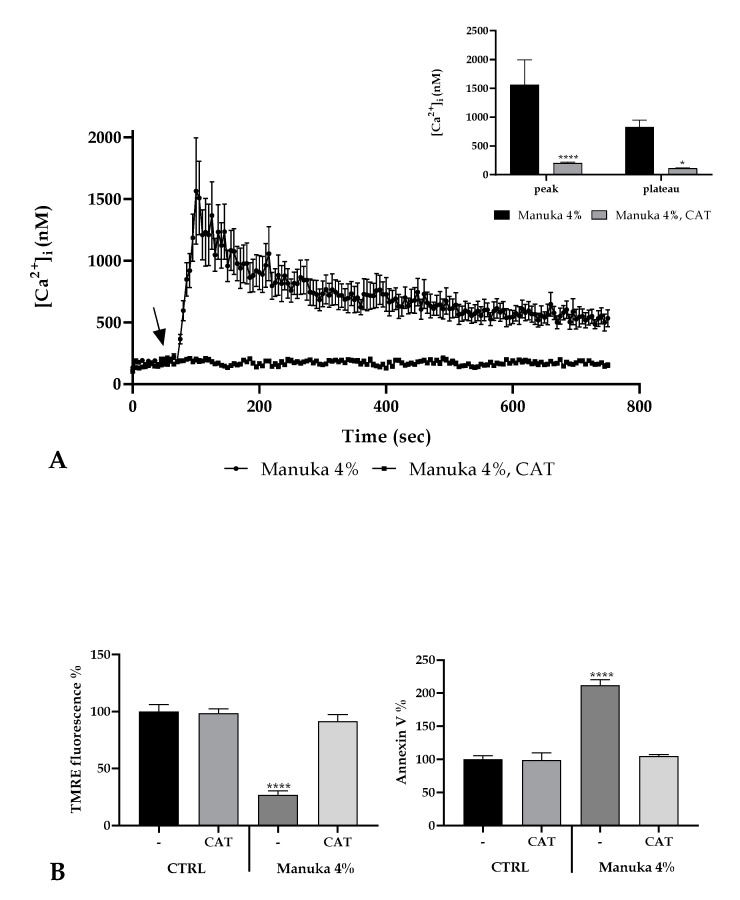
Figure 6.
ROS involvement in the manuka honey mechanism of action. (A) The Ca2+ signaling due to 4% manuka honey was completely abrogated by treatment with Catalase (CAT 500U, 30 min pre-incubation). Data are indicated as mean ± SEM of [Ca2+]i traces measured in different cells. The arrow shows manuka honey addition after 60 s. Sample size: manuka honey + CAT: 40 cells from 3 exp; manuka honey: 40 cells from 3 exp. Insert. Mean ± SEM of the Ca2+ peak response measured under the indicated honey exposures. Sample size as in A. Asterisks on bars specify statistical changes determined by Two-way ANOVA followed by Bonferroni correction (**** p < 0.0001, * p < 0.05). (B) TMRE fluorescence (left panel) and Annexin V-FITC fluorescence (right panel) measured in A431 cells treated with 4% manuka honey plus or not 500U CAT. Data are expressed as mean ± SD obtained from 10 independent experiments and expressed as fluorescence %. Asterisks on bars show statistically significant changes evaluated by one-way ANOVA followed by Bonferroni correction (**** p < 0.0001).

