Figure 8.
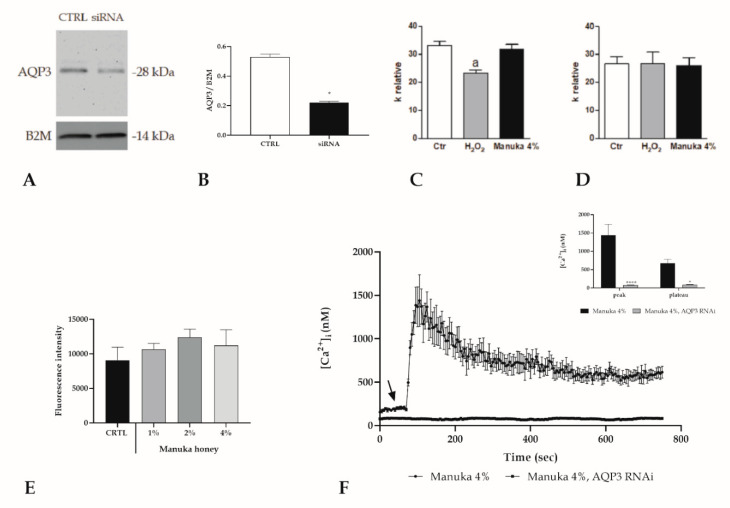
Pivotal role of AQP3 in mediating manuka honey cytotoxicity in A431 cells. (A,B) AQP3 protein levels in A431 cells in control conditions (CTRL) or after AQP3 RNAi (siRNA) treatment. Blots illustrative of three were presented. 30 μg of proteins were loaded for each lane then probed with an anti-AQP3 antibody and processed as specified in the Materials and Methods section. The same blots were then stripped and incubated with an antibody against anti-beta-2-microglobulin (B2M) as housekeeping (* p < 0.001, t-test). (C,D) Effect of H2O2 and 4% Manuka on the water osmotic permeability of A431 cells wild type and AQP3-KO. Cells were exposed to a 150 mOsm osmotic gradient in three different settings: untreated cells (Ctr), cells treated with 50 mM H2O2 for 45 min and treated with 4% manuka honey for 45 min. Bars indicate the osmotic water permeability of A431 cells expressed as a k relative. Values are expressed as mean ± SEM of 4–15 single shots for each of four different experiments. p < 0.05 vs. Ctr and Manuka 4% (ANOVA followed by a Newman–Keuls Q test). (E) Fluorescence values assessed at 10 min in silenced (RNAi AQP3) cells, incubated with increasing manuka honey concentrations (1, 2 and 4%). Data are shown as mean ± SD of rhodamine 123 fluorescence expressed in arbitrary units; n = 16 micro-plate wells from two different experiments. Statistics determined by one-way ANOVA followed by a Dunnet post-test. (F) The Ca2+ response to 4% v/v manuka honey was inhibited in A431 cells transfected with the RNAi selectively targeting AQP3. The arrow specifies the addition of honey after 60 s. Data are indicated as mean ± SEM of [Ca2+]i traces recorded in different cells. Number of cells: manuka honey + siRNA: 40 cells from 3 exp; manuka honey: 40 cells from 3 exp. Insert. Mean ± SEM of the peak Ca2+ response recorded under the designated treatments. Number of cells as in D. Asterisks on bars indicate statistically different changes assessed by two-way ANOVA followed by Bonferroni correction (**** p < 0.0001, * p < 0.05).

