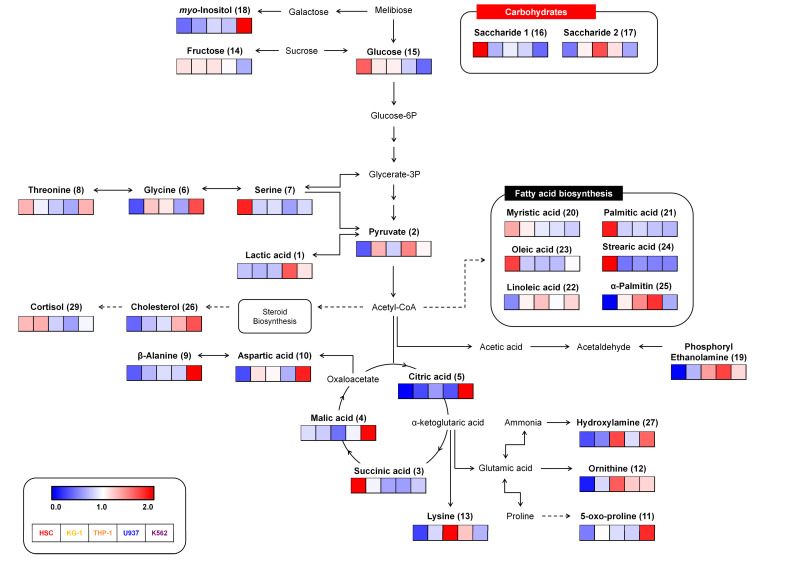
Figure 3.
Constructed metabolic pathway showing relative metabolite contents for four different leukemia cell lines and a normal hematopoietic stem cell (HSC) line. The pathway was modified from the Kyoto Encyclopedia of Genes and Genomes (KEGG) database (http://www.genome.jp/kegg/). The colored squares (blue-to-red) represent relative metabolite abundance in the five cell lines.

