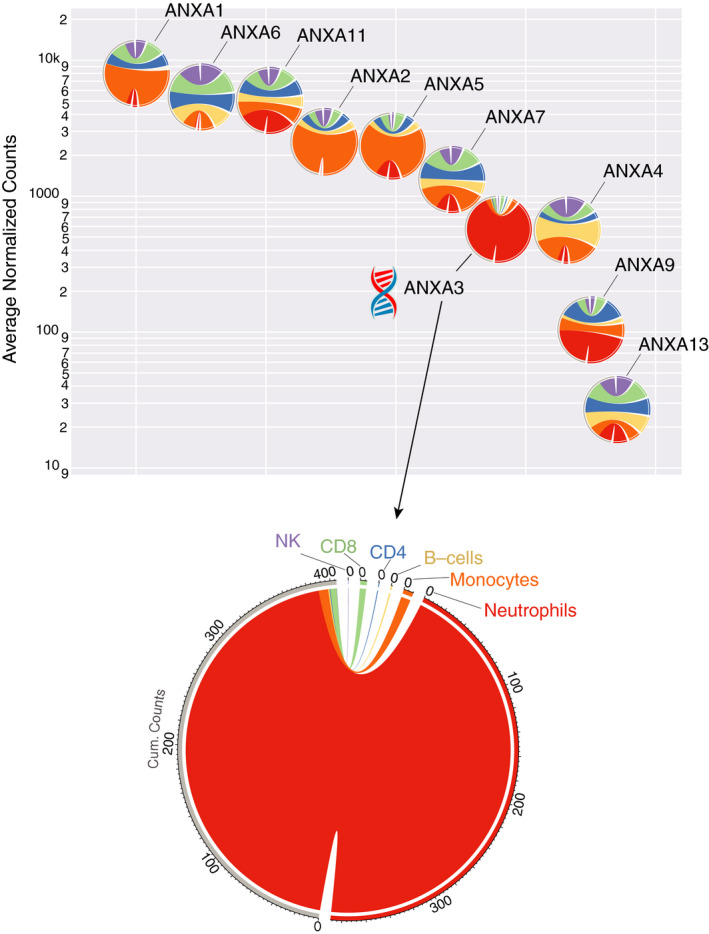
Figure 3.

Annexin A3 (ANXA3) shows the most restricted expression to neutrophils of all Annexin family member transcripts. Each chord diagram (circle) presents the relative transcript abundance for a given gene across six leucocyte populations: neutrophils, monocytes, B‐cells, CD4 T‐cells, CD8 T‐cells and NK cells. The colours assigned to each cell population are shown on the ANXA3 diagram (bottom). The predominance of a given colour in a diagram indicates a tendency of expression of the Annexin family member to be preferentially restricted to a given leucocyte population. ANXA3 is predominantly coloured red, indicating the restricted expression of this transcript to neutrophils. Conversely, ANXA2 and ANXA5 are predominantly coloured orange, indicating the preferentially restricted expression of these transcripts to monocytes. Placement of the diagrams along the y‐axis indicates the average abundance levels (expressed as normalized counts) of each Annexin family member. Placement along the x‐axis reflects the arrangement in descending order of average intensity. The segments on the right are partitioned by cell type, and their size is determined according to the average counts of each population across the 20 study subjects [14 in the case of natural killer (NK) cells]. The ribbons for each segment on the right connect to the same segment on the left, which consists of the sum of average counts (cum. counts). The plots were generated using the ‘Circlize’ R package. 58 Levels of expression of ANXA3 in neutrophils were found to be significantly higher than in all other cell types (P < 0·001; interactive box plot: http://sepsis.gxbsidra.org/dm3/miniURL/view/Pv).
