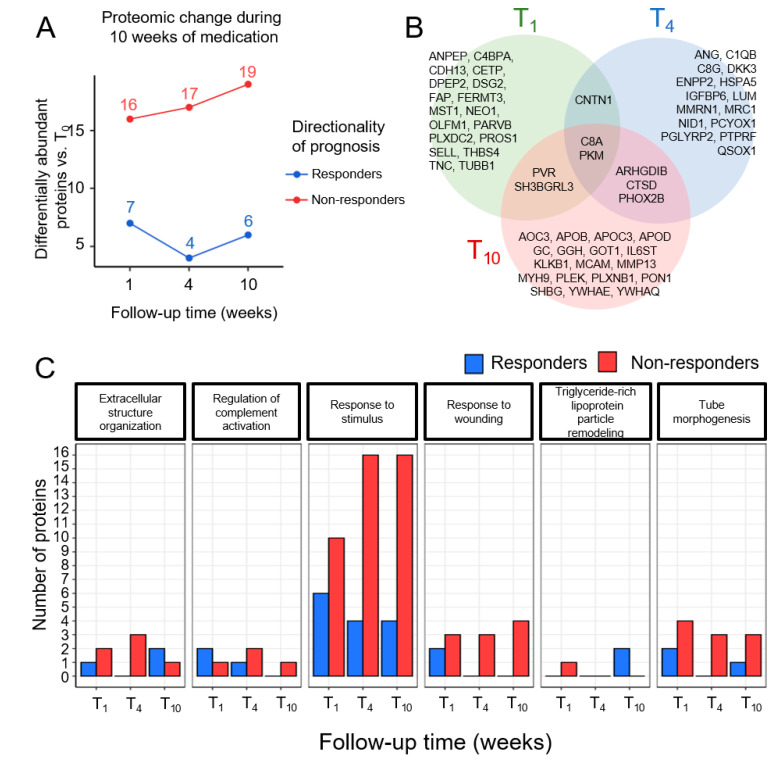
Figure 1.
Plasma proteomic analyses and functional annotations identifying changes in differentially abundant proteins over the first week of drug administration. (A) Time-dependent up- and downregulation of differentially abundant proteins compared with the start of drug administration; T0. The number of proteins altered at each time point is shown above each time point. (B) Venn diagram of proteins differentially abundant at T1, T4, and T10 vs. T0. (C) Gene ontology terms of proteins differentially up- and downregulated at T1, T4, and T10 vs. T0.

