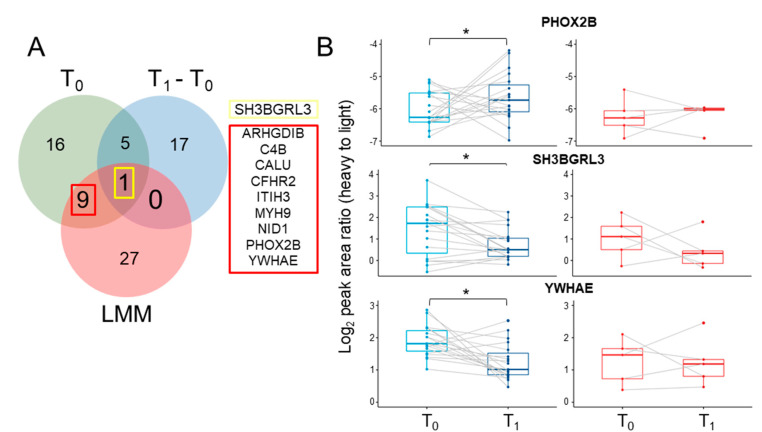
Figure 4.
Liquid chromatography-multiple reaction monitoring/mass spectrometry (LC-MRM/MS) validation of ten candidate predictive biomarkers of early-drug response. (A) Venn diagram for detection of candidate biomarkers by three statistical analyses (T0 vs. T1 and T1–T0 between two groups, and response/time terms in LMM). (B) Boxplot of abundance of PHOX2B, SH3BGRL3, and YWHAE at T1 vs. T0, as determined by LC-MRM/MS, in responders (blue color) and non-responders (red color). * The asterisk identifies the adjusted p-values that are significant at the 0.05 level.

