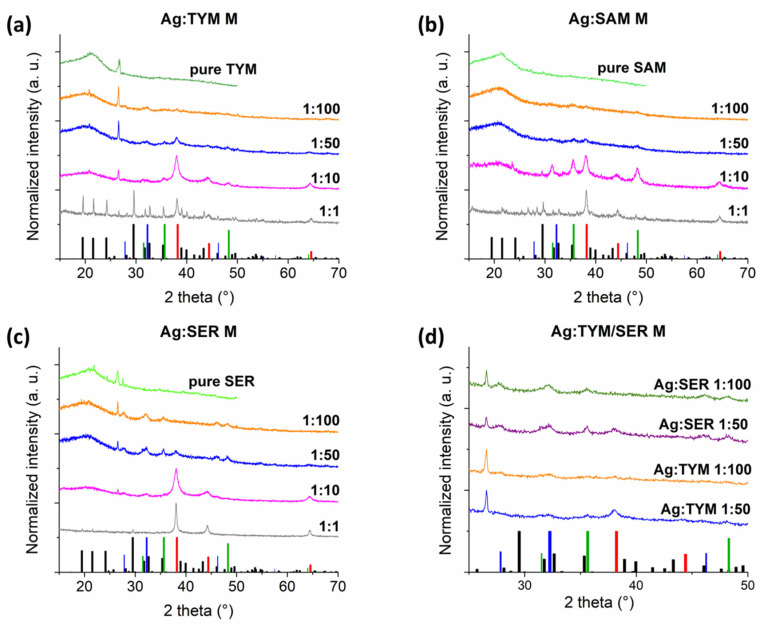
Figure 1.
XRD patterns of AgNPs embedded in the plant matrix and that of the pure plants after milling; (a) Ag:TYM M; (b) Ag:SAM M; (c) Ag:SER M; (d) the zoomed region between 27° and 50° for the TYM- and SER-rich M samples (bars at the bottom refer to XRD of ICDD PDF2 database: AgNO3 (black, 074-2076), Ag (red, 65-2871), WC (green, 51-0939) and AgCl (blue, 71-5209)).

