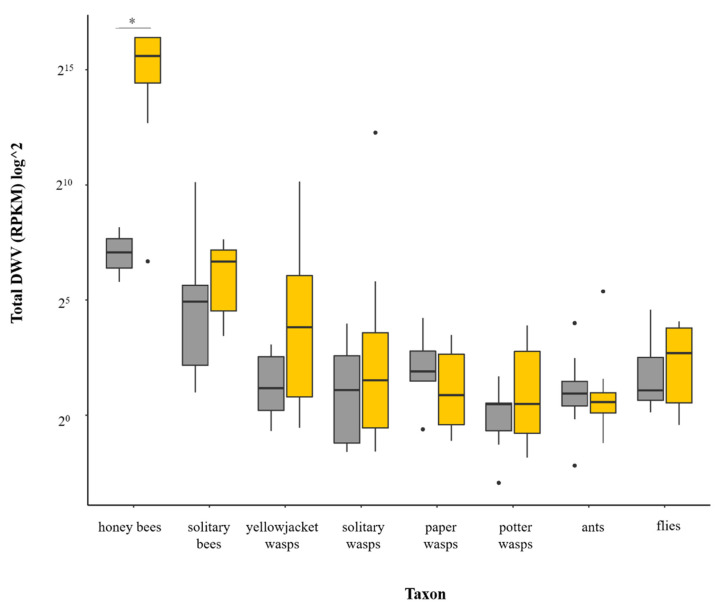
Figure 1.
DWV read counts detected in each taxon group. Averages were calculated for each taxon with individuals pooled according to whether they were collected from an island with no-Varroa (grey) or with Varroa (yellow). Boxes represent 25th to 75th percentiles with medians shown with a black bar, estimated confidence intervals shown with hinges and outliers represented by dots. Statistical differences between Varroa and no Varroa samples in each taxon group (Kruskal Wallis tests) are denoted by an asterisk.

