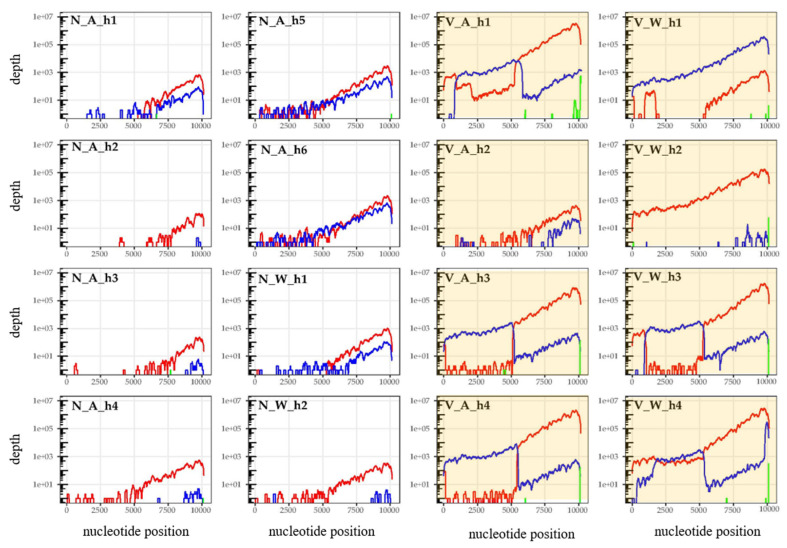
Figure 2.
DWV genome coverage plots for all honey bee samples. Samples collected from Varroa-free islands are shown with white backgrounds (sample names beginning “N”) and those from islands with Varroa are shown with yellow (sample names beginning “V”). Those collected from apiary sites (“apiary”) are shown with an “A” and those collected away from managed bees (“non-apiary”) are shown with a “W”. DWV-A coverage is shown in red, DWV-B in blue and DWV-C in green (negligible amounts).

