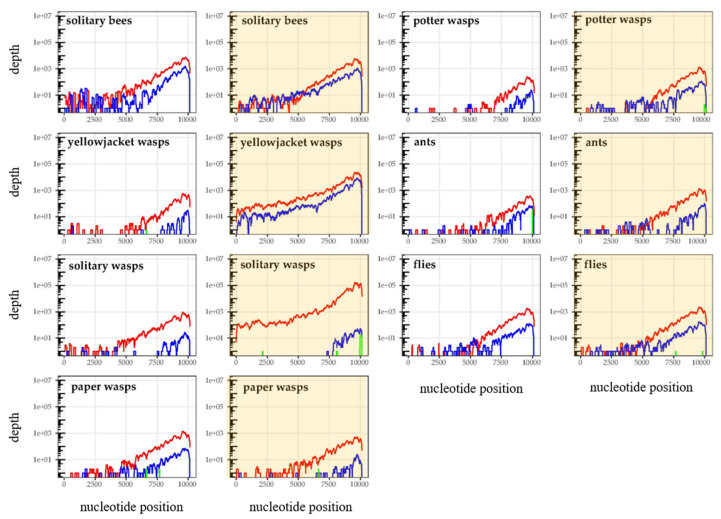
Figure 4.
DWV coverage plots for all non-honey bee samples, pooled according to whether they were collected from with-Varroa (yellow background) or no-Varroa (white background) islands. DWV-A coverage is shown in red, DWV-B in blue and DWV-C in green. Each plot shows the total mapped DWV reads from the four individual samples per group.

