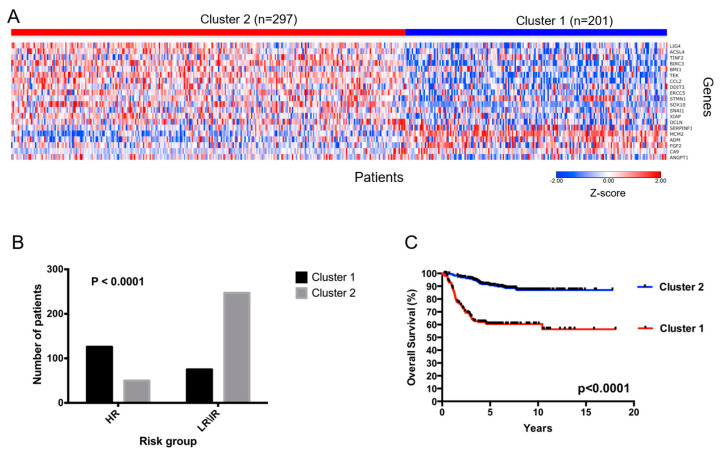
Figure 3.
Progression of Tumorigenesis Genes (PTGs) and Progression of Neurogenesis Genes (PNGs) are prognostic and stratify neuroblastoma (NB) patients in two groups. (A) The panel shows a heat map for the 20 genes in the 498 neuroblastoma tumor dataset. The expression for each gene has been scaled using a z-score transformation and is represented by pseudo-colors in the heat map. Red color corresponds to high level of expression and blue color corresponds to low level of expression. The color key is located in the bottom right side of the plot. The 498 patients (columns) were divided into two groups by unsupervised k-means clustering. Cluster 1 consists of 201 patients and cluster 2 consists of 297 patients. The expression values of the 20 genes are shown (rows). The name of the genes is reported on the right side of the heat map. (B) Panel shows the number of patients of each cluster for each risk group. Risk was divided in two groups on the basis of the prognosis. The groups are high-risk vs. low-\intermediate- risk. Association between the cluster and the risk group was assessed by Fisher exact test. Fisher p value is reported in the top left part of the plot. p value lower than 0.05 is considered significant. (C) Panel shows the Kaplan Meier for 498 neuroblastoma patients divided in two clusters. Curves are relative to the patient overall survival expressed in years. Blue and red curves represent good and poor prognosis patients, respectively. The p-value of the log-rank test is shown.

