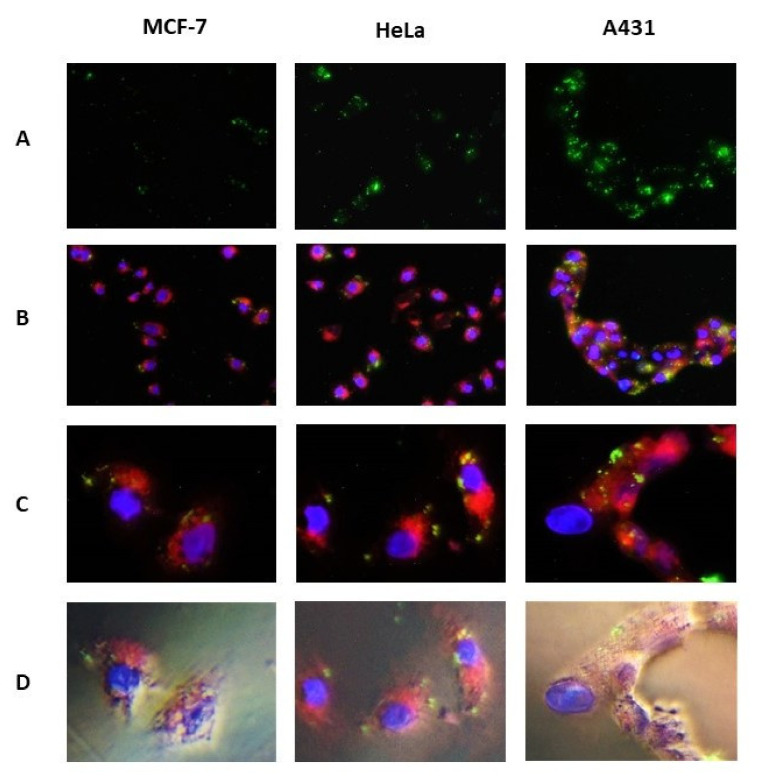
Figure 9.
Microscopic analysis of localization of G-quadruplexes formed by Fl-Q-ASO (100 nM) and EGFR mRNA in MCF-7, HeLa and A431 cells. G4s are shown in green (indicated by the white arrows), cell ER membranes are stained in red (ER-Tracker Red), and dsDNA in the cell nuclei are stained in blue (DAPI). Panel D: phase contrast merged with the images shown in the panel C. Panels (A,B): 20-fold enlargement. Panels (C,D): 60-X magnification.

