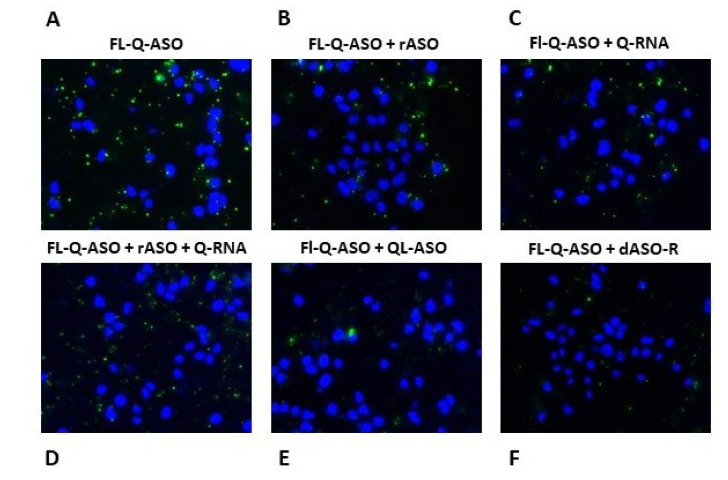
Figure 10.
Fluorescence analysis of G4 green fluorescent structures in A431 cells, which were stained with DAPI (visualization of dsDNA in nuclei) and transfected with Fl-Q-ASO (100 nM) (A) along with the following inhibitory ASOs (100 nM): rASO (B), Q-RNA (C), rASO+QRNA (1:1 molar ratio) (D), QL-ASO (E) and dASO-R (F).

