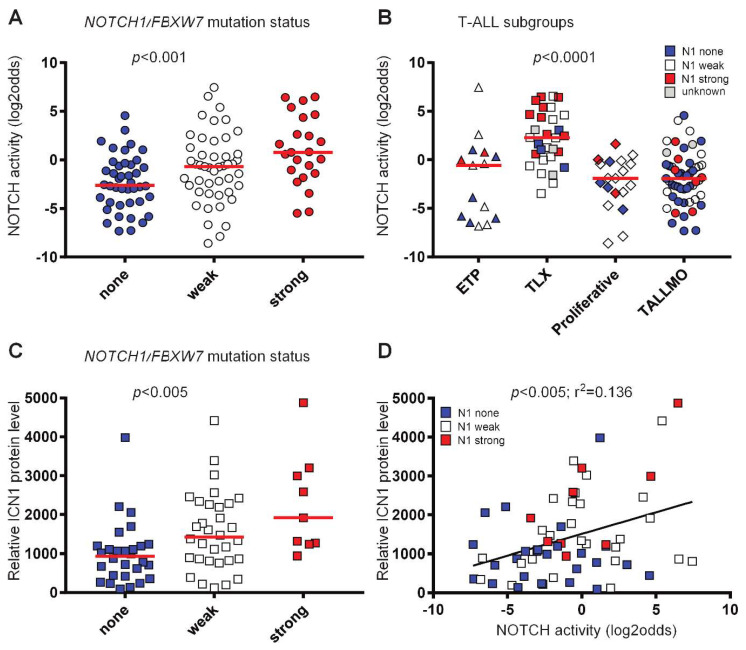
Figure 2.
Notch pathway activity in T-ALL. (A–D) GSE26713 [98]. No NOTCH-activating mutations (blue symbols), weak NOTCH1-activating mutations (NOTCH1 heterodimerization domain, PEST domain or in FBXW7) (white symbols) and strong NOTCH1-activating mutations (juxtamembrane domain or more than one NOTCH1 activating mutation) (red symbols) are indicated. p-values are indicated. (A–C) Kruskal–Wallis statistical test. Medians are indicated by the red lines. (D) Linear regression test. (A) Notch pathway activity of T-ALL samples (n = 112) per NOTCH1/FBXW7 mutation status group. (B) Notch pathway activity per T-ALL subgroup (n = 117). Five samples have an unknown NOTCH1/FBXW7 mutation status (grey symbols). (C) Active intracellular NOTCH1 (ICN1) protein level measured in relative intensity units using reverse-phase protein array (RPPA), indicated per NOTCH1/FBXW7 mutation status group (n = 69). (D) Correlation of active intracellular NOTCH1 (ICN1) protein level and Notch pathway activity (n = 62).

