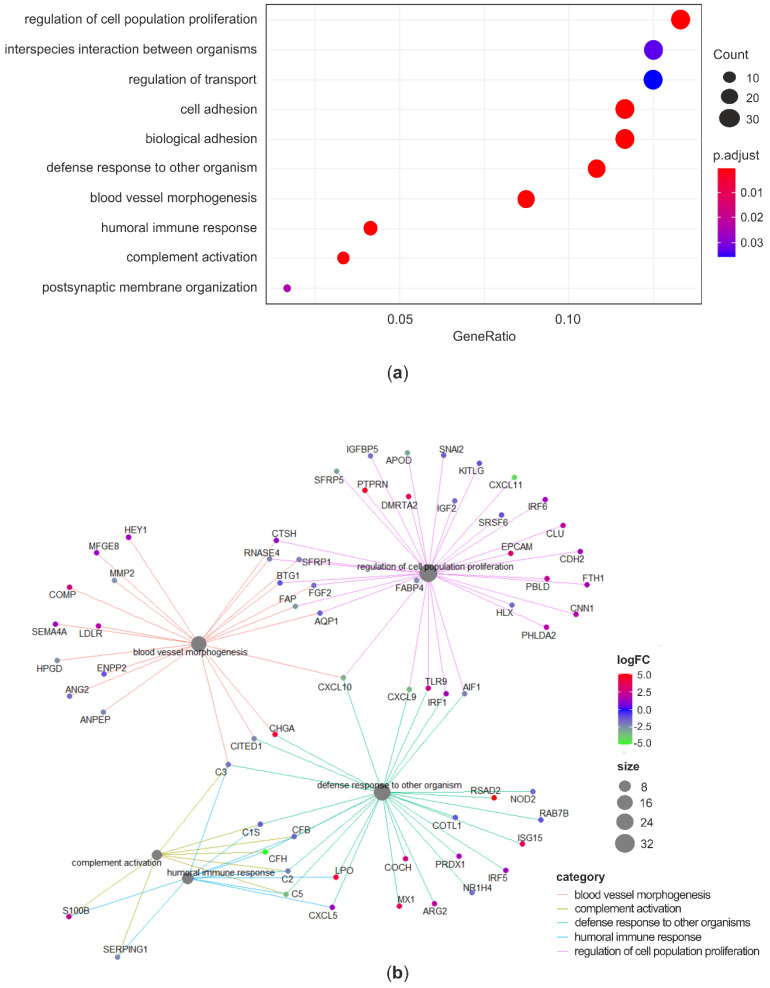
Figure 5.
Gene ontology analysis: C vs. CTRL. Dotplot reporting the over-represented BP terms in the list of DEGs between C and CTRL (a). Gene-concept network linking DEGs and enriched BP terms (b). GO terms redundancy was removed by using the simplify method (similarity cutoff = 0.5). ‘Count’ is the number of genes enriched in a GO term. ‘Gene ratio’ is the percentage of total DEGs in the given GO term. p-values were adjusted using the Benjamini–Hochberg method.

