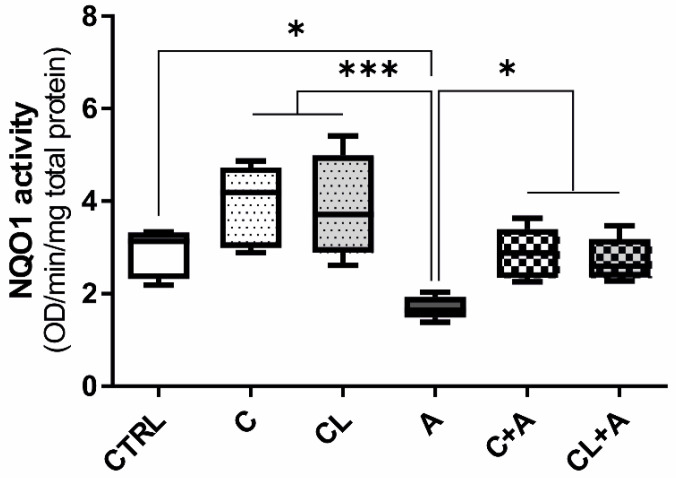
Figure 8.
NQO1 enzyme activity. Box and whiskers plot reporting the NQO1 activity in the different experimental conditions. The median NQO1 activity in cells exposed to AFB1 was compared to the activity observed in all the other experimental conditions. Data are obtained from six independent cell culture experiments and expressed as median optical density (OD) observed per min per mg of total protein. CTRL condition corresponds to cells exposed to PCB126 only. C = curcumin; CL = Curcuma longa; A = AFB1. * p ≤ 0.05; *** p ≤ 0.001 (one-way ANOVA, followed by Dunnett’s multicomparisons test).

