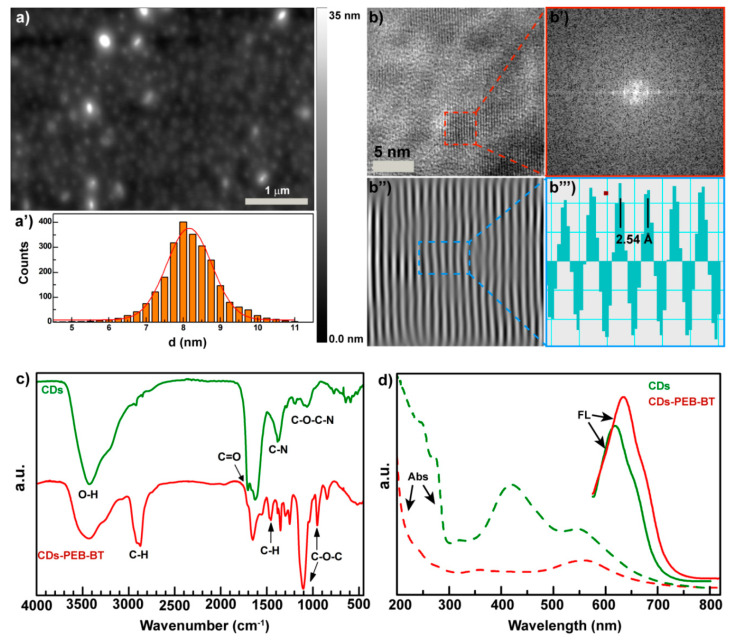
Figure 2.
Physicochemical characterization of the CDs-PEG-BT. Atomic force microscopy (AFM micrograph (a) and size distribution (a’) of the CDs-PEG-BT. HRTEM micrograph (b), fast Fourier transform (FFT) (b’), inverse fast Fourier transform (IFFT) (b’’), and d-spacing calculation (b’’’) of the CDs-PEG-BT. FTIR spectra of the CDs-PEG-BT compared with the bare CDs (c). Absorption and emission spectra excited at 550 nm of an aqueous dispersion of CDs-PEG-BT and the bare CDs (d).

