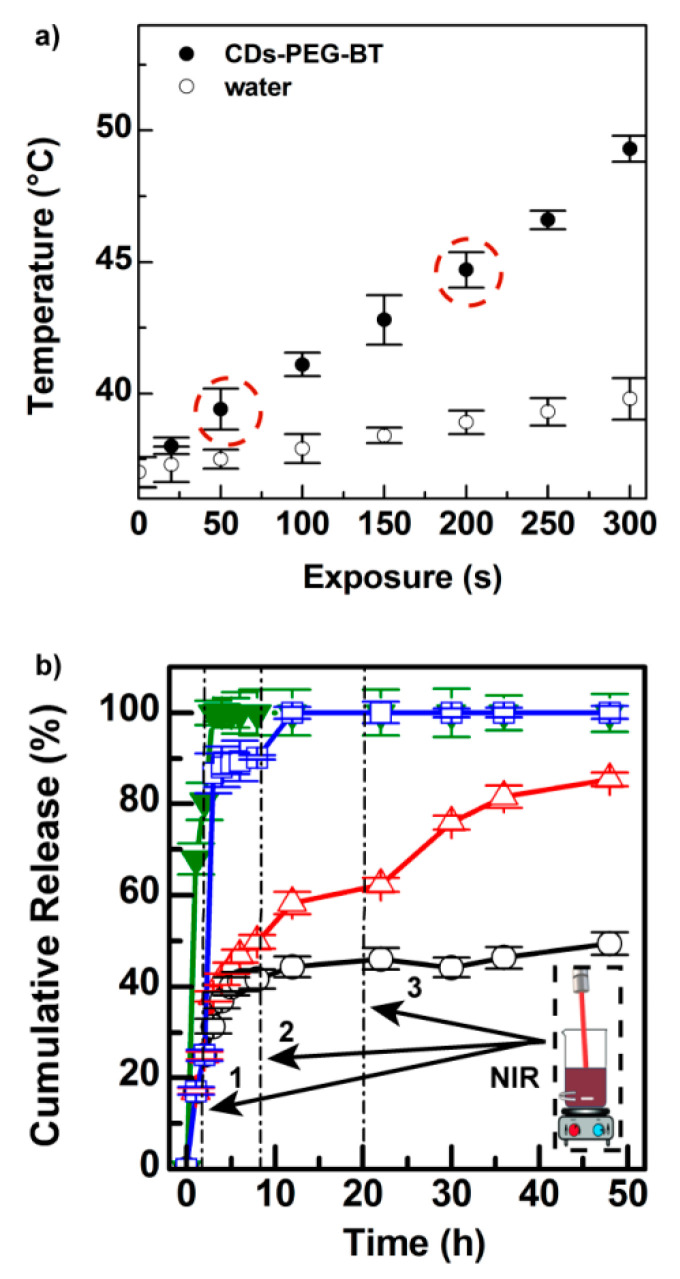
Figure 3.
Photothermal kinetics of the CDs-PEG-BT in PBS pH 7.4 (0.5 mg mL−1) (solid symbol) compared with pure phosphate buffered saline (PBS) (open symbol) (a). Drug release profiles of CDs-PEG-BT/IT in PBS pH 7.4 compared with the diffusion profile of the free IT (green line) at the equivalent concentration (b): without 810 nm laser exposure (black line), after three cycles of NIR exposure for either 50 s (red line) or 200 s (blue line) at low power density (2 W cm−2). Release profiles of CDs-PEG-BT/IT in PBS pH 7.4 after three cycles of 810 nm laser exposure for either 50 or 200 s (2 W cm−2).

