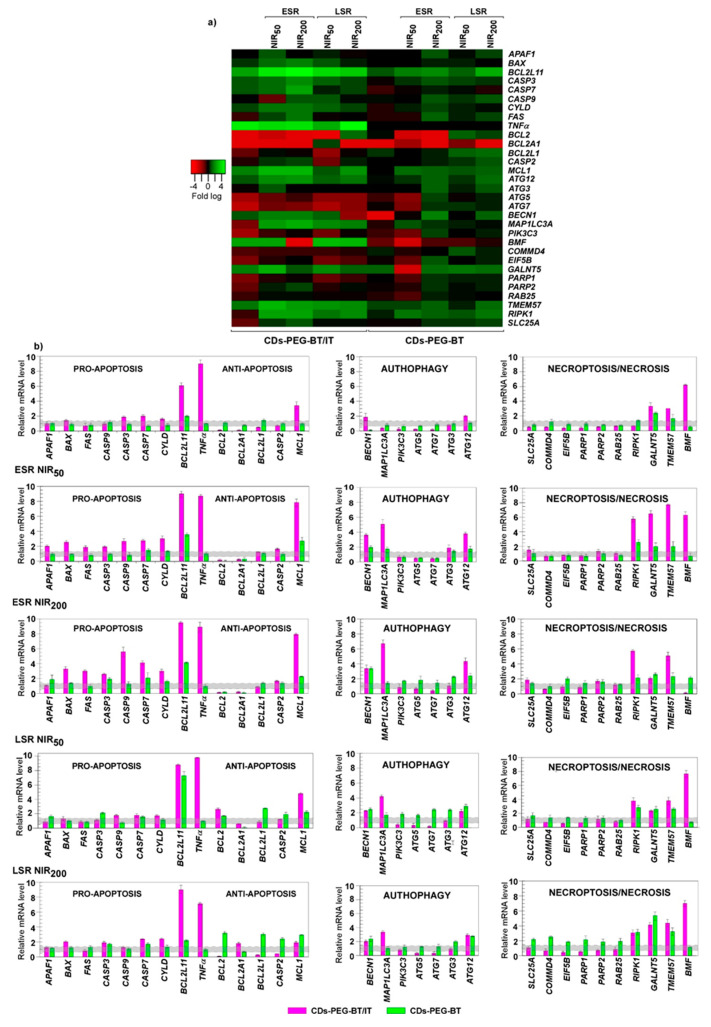
Figure 6.
Cell death pathway focused gene expression analyses in MDA-MB-231. (a) Heat map representation of the mean-centered data of RT-qPCR results showing the mRNA levels of analyzed genes in presence of CDs-PEG-BT or CDs-PEG-BT/IT with respect to 18S, GAPDH, and ACTB. Gene expression values are colored from red (low) to green (high). Fold-changes in log (2)-transformed values are represented. (b) Bar plot of the pathway focused gene expression profiling. The early stage response (ESR) and long stage response (LSR) measured in response to 50 and 200 s of photothermal insults (NIR50 and NIR200) are showed. Values beyond the gray zone were considered statistically significant at p ≤ 0.05. Statistical analyses by Student’s t-tests are reported in Table S2.

