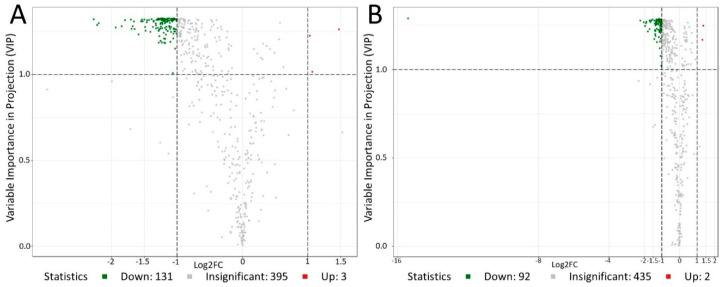
Figure 5.
Volcano map of differential metabolites between the pre-activated sperm and activating sperm (A), pre-activated sperm and post-activated sperm (B). Each point in the figure represents a metabolite. Green dots represent down-regulated metabolites, so the number of down-regulated metabolites in A and B is 131 and 92, respectively. Red dots represent up-regulated metabolites, so the number of up-regulated metabolites in A and B is 3 and 2, respectively. Grey dots represent identified but insignificantly different metabolites.

