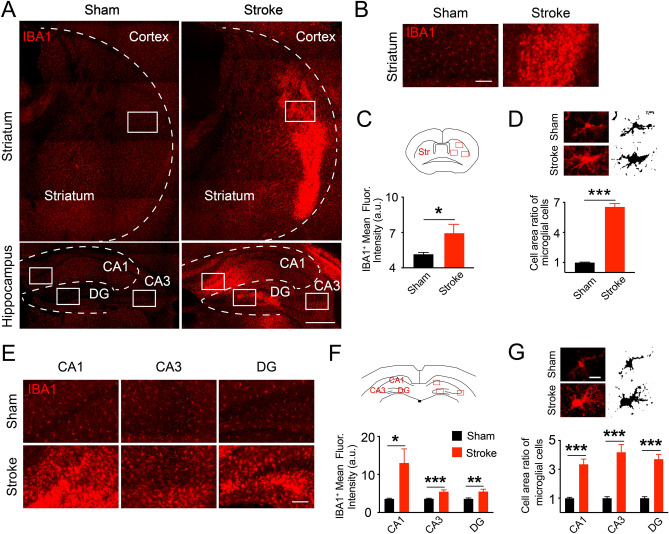
Figure 3.
Reactive microglia in the striatum and hippocampus 4 weeks after hypoxia and ischemia. (A) Overview of the reactive microglia (stained by the microglial marker, IBA1+, red) in ischemic striatum and hippocampus. These reactive microglia could contribute to the secondary neuronal injury in the long term after HI conditions. (B,E) Representative views of the reactive microglia in the striatum and hippocampus. (C,F) The increased IBA1+ expressions in HI mice than sham in both areas. Unpaired t-test in (C,E), *P < 0.05, **P < 0.01, ***P < 0.001. N = 3 mice in each group with 3 slices per animal. Data are collected from three fields in striatum and one field in each hippocampal sub-region shown in cartoons. (D,G) Sample images and cropped cells with binary images showed the hypertrophy status of reactive microglia by larger cell area in the ischemic striatum (D) and CA1 (G). Unpaired t-test, **P < 0.01, ***P < 0.001. For area analysis, N = 15 cells in each slice with 3 slices per animal. The slices were observed by an inverted fluorescent microscope (EVOS FL Auto) and the cropped cells with binary images in (D,G) were performed in Image J 2.0.0 (FIJI). FIJI was also used to analyze the fluorescence intensities and morphological changes. Data are shown as the mean and SEM. Scale bar in (A) is 500 μm, (E) 100 μm and (G) 10 μm.

