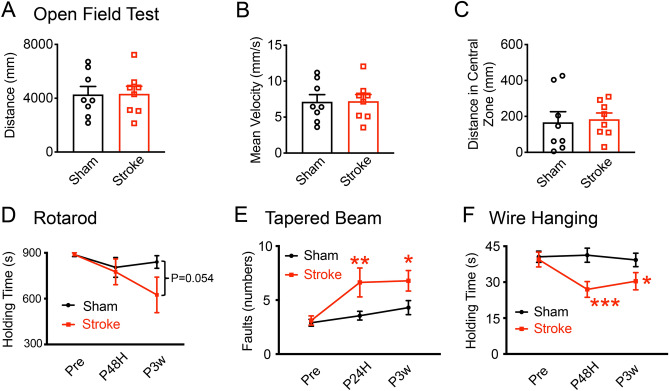
Figure 4.
Motor behavioral deficits in stroke mice. (A)–(C) Represent the similar performances of sham and HI mice in the open field test (OFT) at 3 weeks after stroke. Parameters of the OFT include the total distance (A), the mean velocity (B) and the time spent in the center zone (C). N = 8 mice per group in (A)–(C). (D) Quantitative measurements showed comparable performances of sham and HI mice in the rotarod test. N = 14 mice in sham and N = 10 in stroke group. (E,F) Show the motor deficits of HI mice in the taper beam and wire hanging tests. (E) Increased fault numbers of stroke mice in tapered beam test at 24 h and 3 weeks after stroke than sham group. N = 19 mice per group. (F) Decrease in holding time of HI mice in the wire hanging test at 48 h post ischemia and remaining to 3 weeks after stroke. N = 19 mice per group. Data are shown as the mean and SEM for each group. * Compared with sham group, P < 0.05, **P < 0.01, ***P < 0.001, unpaired t-test in (A)–(C); two-way repeated ANOVA followed by fisher multiple comparison test in (D)–(F).

