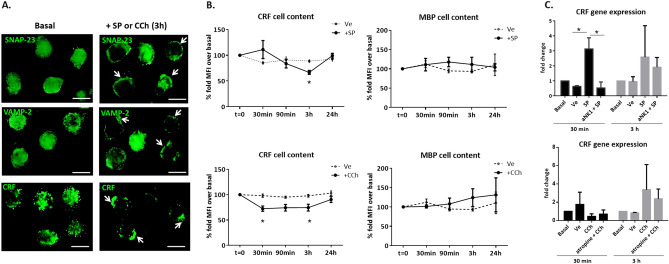
Figure 4.
Localization of CRF in the eosinophil 15HL-60 cell line after exposure to neuropeptides. (A) Representative images of SNAP-23, VAMP-2 and CRF localization at basal and after exposure for 3 h to SP or CCh (one image is shown, as exposure to both neuropeptides yielded similar results). Fluorescence signal in the cytoplasm at basal conditions and relocated (white arrows) to the plasma membrane after exposure to SP or CCh. Images representative of 3 independent experiments, run in triplicate. Bars indicate 10 μm. (B) Intracelluar CRF and MBP content over the time course exposure to SP or CCh identified by flow cytometry. Percentage of fold mean fluorescence intensity (MFI) change over basal condition expressed as mean ± standard error (n = 8 independent experiments for SP and CCh). (C) CRF gene expression at 30 min and 3 h after exposure to neuropeptides. Fold-change calculated by normalizing data with the endogenous control gene (PPIA), comparing each time point to untreated cells. Graphs represent results from 3 independent experiments, run in triplicate. Data are expressed as median (range). *P < 0.05; SNAP23: Synaptosomal-associated protein 23; VAMP-2: Vesicle-associated membrane protein 2; SP: Substance P; CCh: carbachol; CRF: corticotropin releasing factor; Ve: vehicle.

