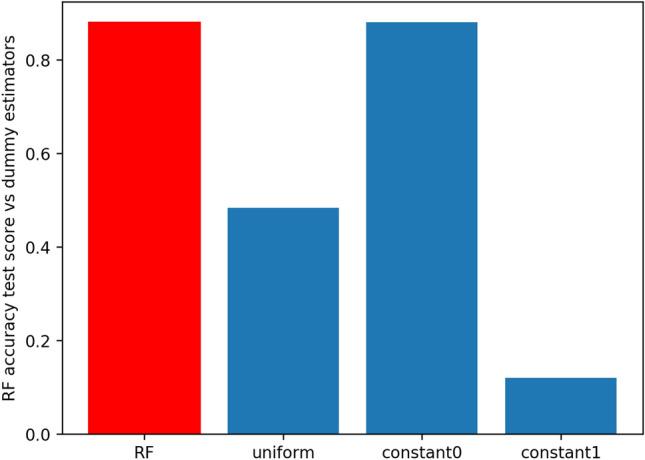
Figure 2.

Comparative analysis of the accuracy score for the random forest predictor (in red) and 3 dummy predictors (in blue). The uniform predictor predicts with equal probability that a subject has or has not MCI. The “constant0” or majority predictor, always predicts the majority class (not MCI), and conversely, the “constant1” or minority predictor always predicts the minority class (MCI). The accuracy score in the test set of the random forest is 0.875, for the uniform predictor is 0.542, the majority predictor is 0.877 and for the minority predictor is 0.123.
