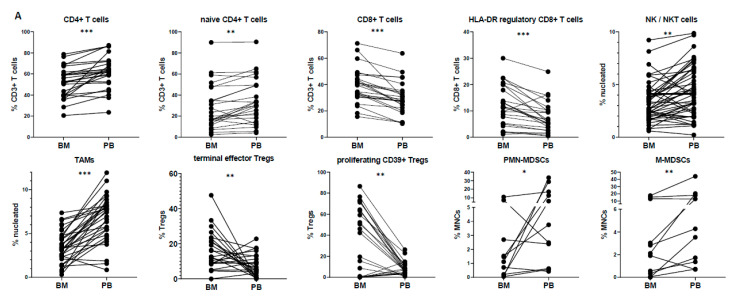
Figure 2.
(A) Pairwise comparison of subset distributions between the bone marrow (BM) and peripheral blood (PB); (B) differences plot displaying the pairwise differences (PB minus BM) of normalized expression measures for all immune subsets. Subsets that tend to mirror between PB and BM appear on the left side of the plot. * p < 0.05; ** p < 0.01; *** p < 0.001.


