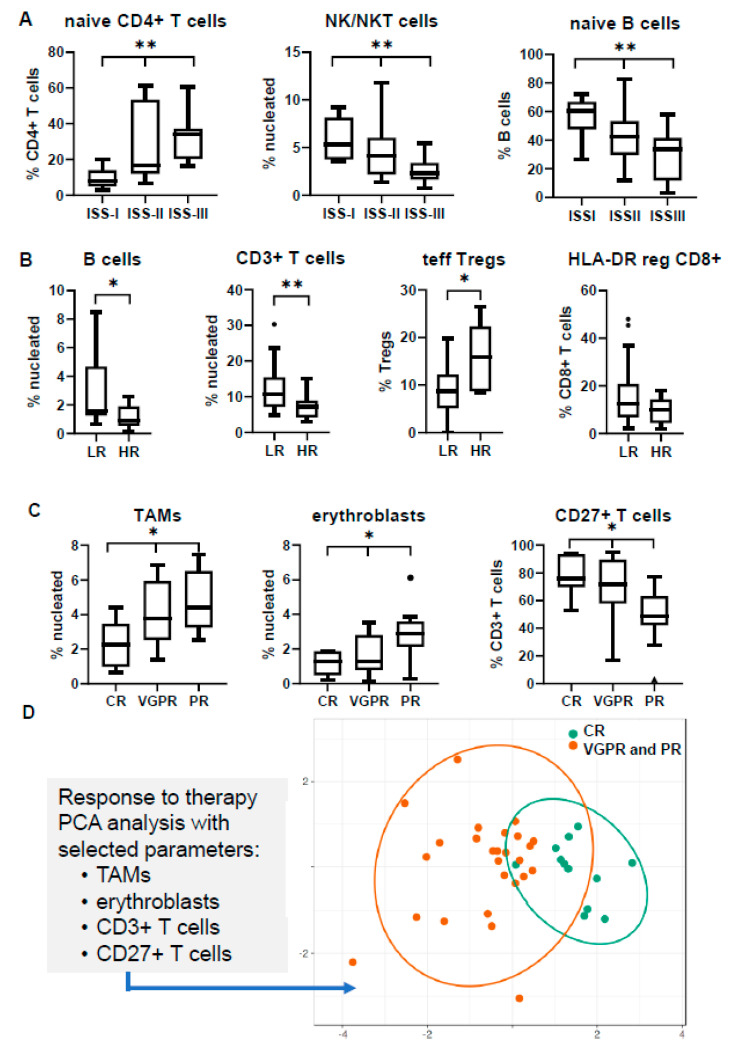
Figure 3.
Distribution of bone marrow (BM) subsets in different clinical and prognostic groups at the time of diagnosis. Comparisons refer to (A) the International Staging System (ISS); (B) cytogenetics; (C) response to therapy; (D) PCA analysis of selected BM subsets according to therapeutic response. * p < 0.05, ** p < 0.01; HR: high-risk; LR: low-risk; CR: complete response; VGPR: very good partial response; PR: partial response; TAMs: tumor-associated macrophages; PCA: principal component analysis.

