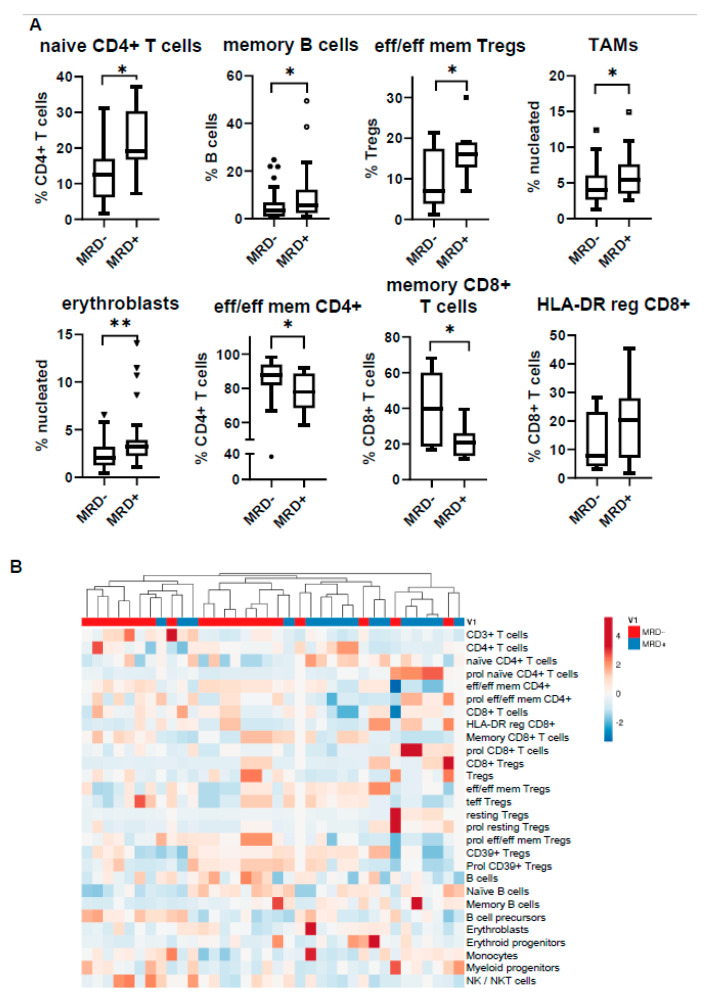
Figure 5.
Bone marrow profiling of minimal residual disease (MRD)-positive (MDR+) vs. MRD-negative (MRD−) patients. (A) Comparison of subset distribution according to MRD status; (B) heatmap displaying the unsupervised hierarchical clustering of MRD patients based on their entire immune composition. * p < 0.05, ** p < 0.01.

