Figure 6.
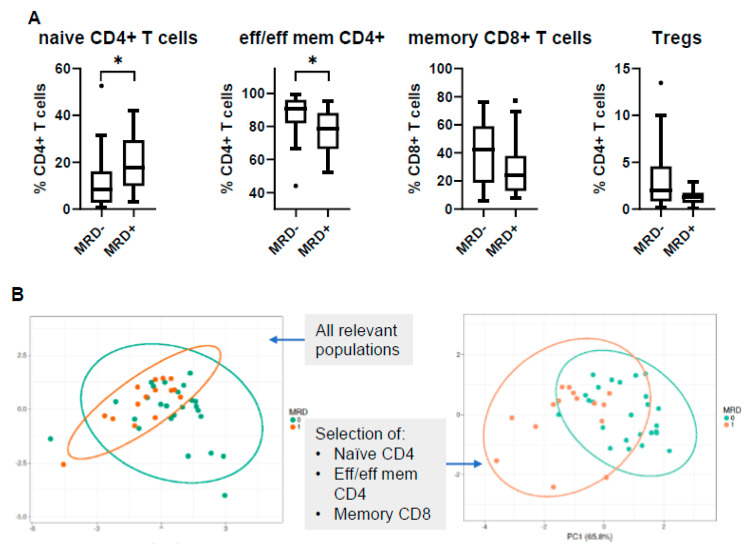
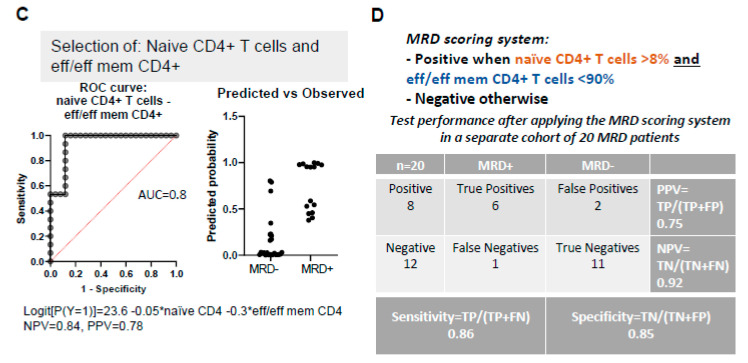
Peripheral blood (PB) profiling of MRD-positive (MRD+) vs. MRD-negative (MRD−) patients. (A) Relative frequencies of selected subpopulations according to MRD status; (B) PCA analysis including the whole immune pattern as input variables (left); PCA analysis including only selected subsets with significant differences among MRD groups (right); (C) selection of naïve CD4+ and effector/effector memory CD4+ T cells allowed the prediction of MRD status with an AUC = 0.8; (D) MRD scoring system based on selected cut-off values for naïve CD4+ and effector/effector memory CD4+ T cells, tested on a different patient cohort (n = 20). The negative predictive value (NPV) of the scoring system was improved to 0.92. * p < 0.05; AUC: area under the curve; TP: true positive; TN: true negative; FP: false positive; FN: false negative; PPV: positive predictive value; NPV: negative predictive value.


