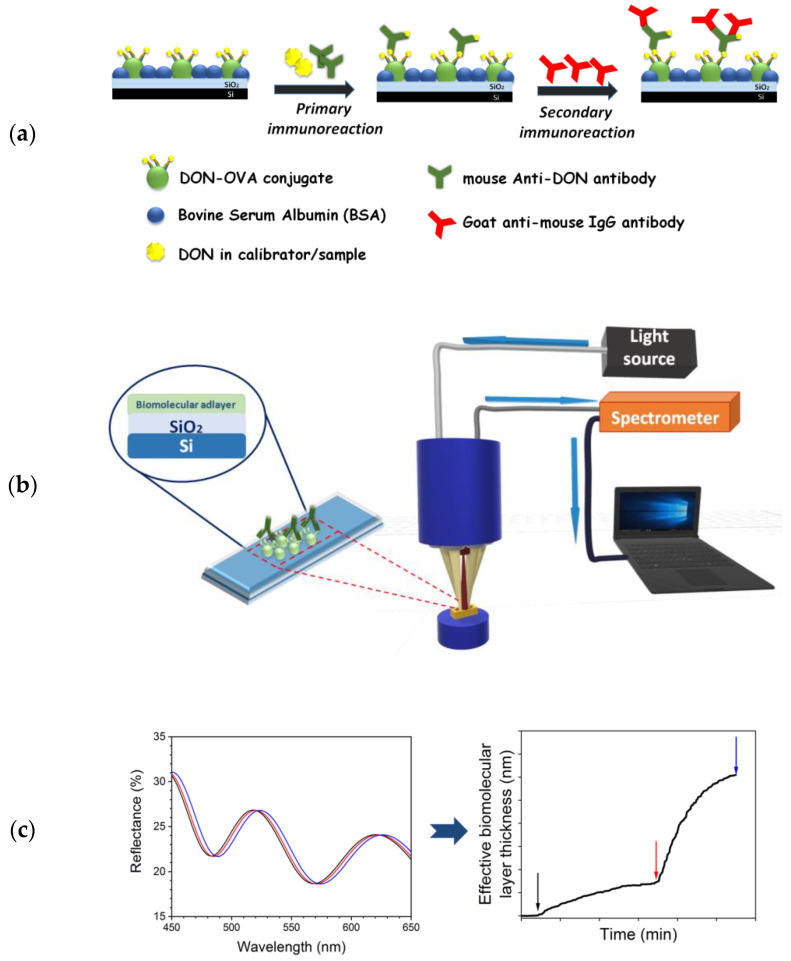
Figure 2.
(a) Schematic of the immunoassay format and steps. (b) Schematic of the instrumentation employed for DON determination. (c) The transformation of spectral shifts due to primary (red line in the left graph) and the secondary immunoreaction (blue line in the left graph) with respect to baseline (black line in the left graph) to “effective biomolecular layer thickness” (the black, red and blue arrows in the right graphs correspond to baseline, end of primary immunoreaction, and end of secondary immunoreaction, respectively).

