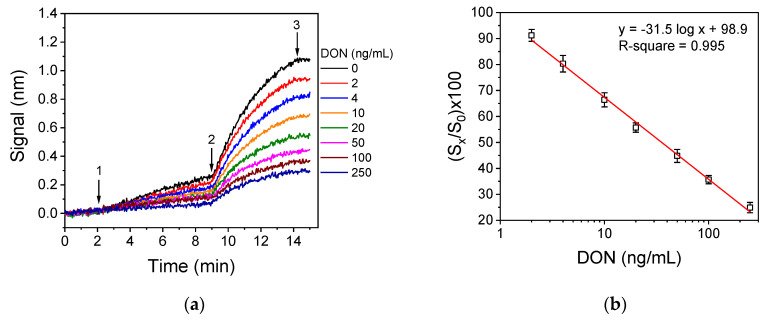
Figure 5.
(a) Real-time responses obtained for DON calibrators with concentration 0–250 ng/mL. The solutions which were flowed over the chips were as follows: assay buffer (start to arrow 1; 2 min), 1:1 (v/v) calibrator/anti-DON mAb mixture (arrow 1 to 2; 7 min), anti-mouse IgG antibody (arrow 2 to 3; 5 min), and assay buffer (arrow 3 to end; 1 min). (b) Typical linearized DON calibration curve (Equation (2)) obtained with calibrators prepared in buffer. The linear regression equation and the coefficient of correlation values are provided in the figure. Each point is the mean value of 3 measurements ± SD.

