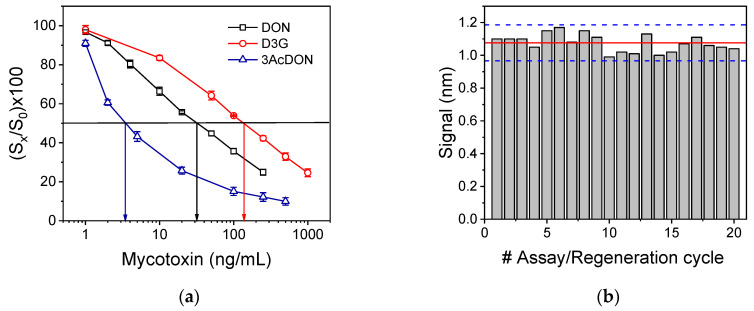
Figure 6.
(a) Calibration curves obtained for DON (open squares), 3-DON-glycoside (open circles), and 3-acetyl-DON (open triangles) using chips coated with DON-OVA. The horizontal to x-axis black line corresponds to (Sx/S0) value of 50%, whereas the vertical to x-axis blue, black, and red lines indicate the mycotoxin concentration that corresponds to 50% (Sx/S0) for each one of the respective calibration curves. (b) Zero calibrator signals obtained from a single chip upon repetitive assay/regeneration cycles. The red solid line indicates the mean value of the 20 measurements and the blue dashed lines the ± 2SD limits. Each point is the mean value of 3 measurements ± SD.

