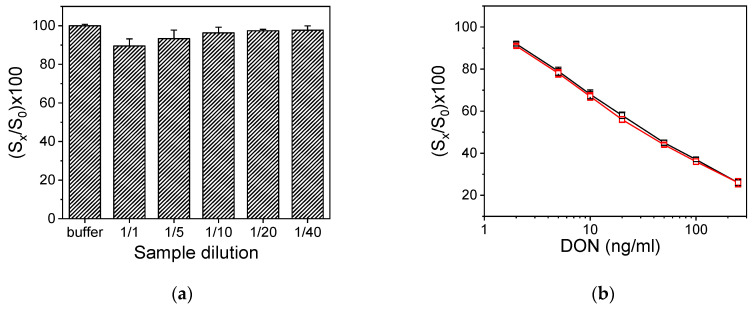
Figure 7.
(a) Effect of maize water extract dilution with assay buffer to zero calibrator signal values with respect to zero calibrator value in buffer. (b) DON calibration curves received with calibrators prepared in assay buffer (black squares) or in maize water extract diluted ten times with assay buffer (red squares). Each point is the mean value of 3 measurements ± SD.

