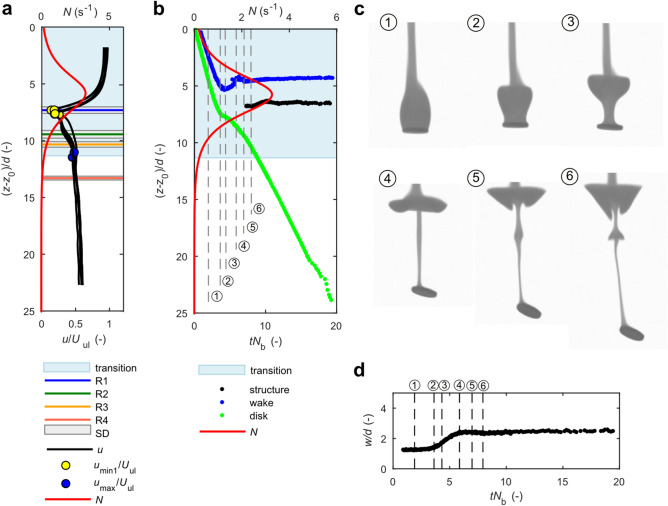
Figure 3.
Evolution of wake structure and settling dynamics of a thick disk (χ = 7) for sample data SET3E3% (other results presented in Supplementary Figs. S9, S10). (a) Normalized settling velocity of disks as a function of vertical position (z—z0)/d, where z = z0 is the position of upper boundary of density transition. (b) Normalized position of the upper edge of a disk (green curve), lower edge of a wake (blue curve) and swelling structure on a jet (black curve) as a function of normalized time, tNb. Numbers indicate time instants shown in panel (c). (c) Time sequence of disk translating through the density transition showing selected instants; the instants are indicated in panels (b) and (d). See Supplementary Movie S3. (d) Temporal evolution of wake’s width, w. Please refer to the text for details.

