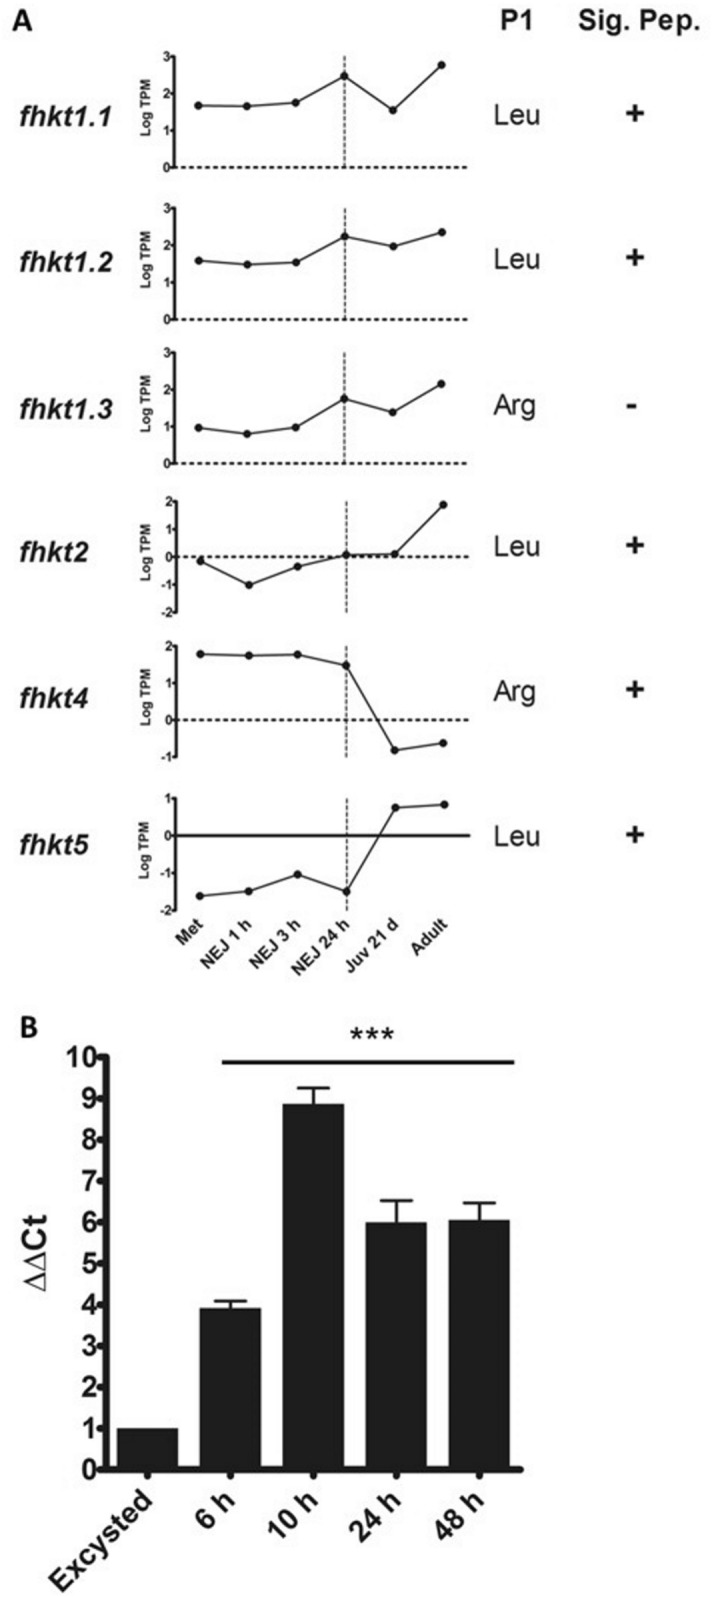
Figure 2.

Temporal regulation of F. hepatica KT gene expression during the mammalian host-associated parasite stages. (A) Graphical representation using Graphpad software (v6 for Windows) of relative gene expression for each member of the F. hepatica KT family represented by log transcripts per million (log TPM) at various stages of the parasite’s lifecycle including the infective metacercariae (met), newly excysted juveniles (NEJ) at 1 h, 3 h and 24 h post-excystment, liver stage juvenile parasites 21-days post infection (Juv 21 d) and bile ducts stage mature adult parasites (adult). The encoded P1 residue and the absence or presence of a signal peptide (Sig. Pep) is shown alongside each graph. (B) Relative fold expression of the genes representing the fhkt1 group during the first 48 h post-excystment by NEJ (normalised to expression at NEJ excystment and relative to a GAPDH reference, with SEM). Statistical analysis was carried out using One Way ANOVA with Tukey’s post hoc test, with all samples showing statistical differences in fold expression compared with the levels at excystment (p < 0.001: ***), visualised using GraphPad Software (v6 for Windows).
