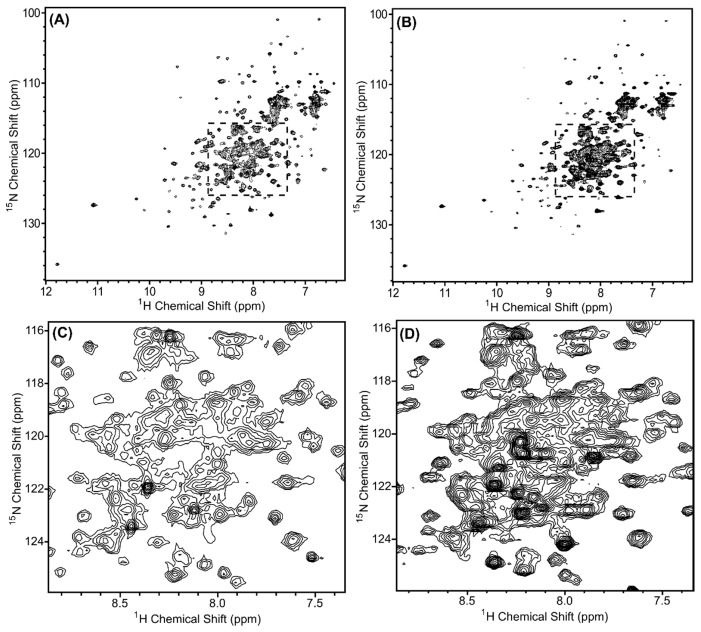
Figure 2.
1H-15N HSQC spectra of the in vivo-associated, 15N-labeled protein complexes (A,C) Scc4:His6-Scc1 and (B,D) His6-Scc4:Scc1-FLAG. The regions shown in (C,D) are expanded from the dashed boxes shown in (A,B). The complexes were 0.35 mM concentration in 50 mM sodium phosphate, 10 mM of DTT, pH 7.3 buffer, and the spectra were collected with 32 scans using a Bruker AVIII 500 MHz spectrometer. Overlays of the spectra are shown in Figure S3.

