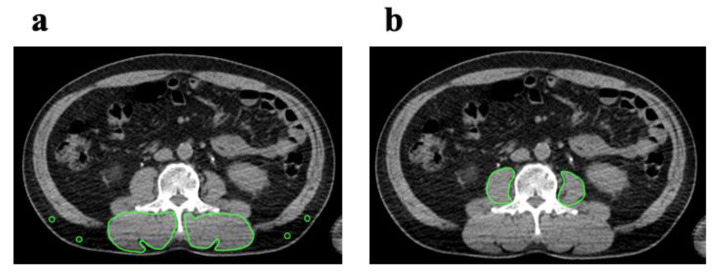
Figure 1.
Cross-sectional CT images at the L3 level. (a) IMAC was evaluated by dividing the CT value of bilateral multifidus muscles according to the CT attenuation value for subcutaneous fat. (b) Subfascial muscle tissue in the multifidus muscle was precisely traced. The PMI was calculated by normalizing the cross-sectional areas to height (cm2/m2). CT, computed tomography; IMAC, intramuscular adipose tissue content; PMI, psoas muscle index.

