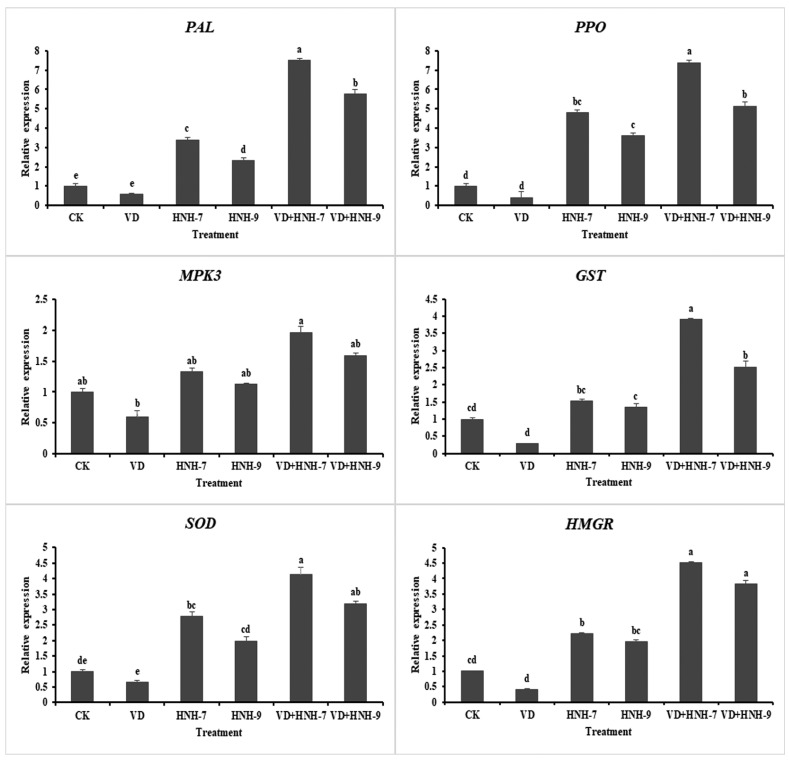
Figure 9.
Expression profiling of 6 defense-linked genes in cotton was upregulated in treatments with the isolates. The mean values were computed and separated by LSD test at p ≤ 0.05 after one-way ANOVA. The error bars indicate the standard error ± SE of the mean values. Letters above the columns (a–e) represent significant differences between treatment means at p ≤ 0.05.

