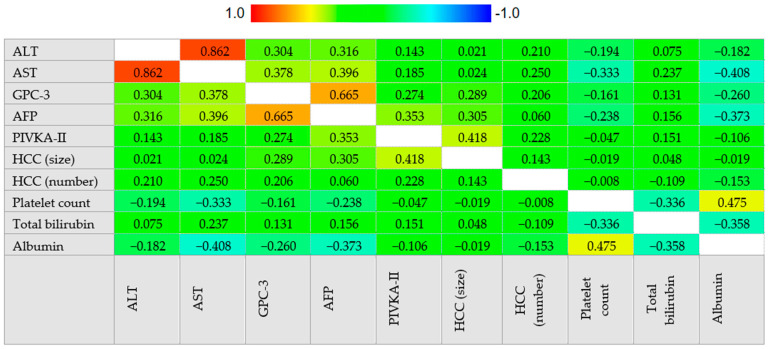
Figure 4.
Correlogram. Correlation between continuous variables was assessed by Spearman’s rank correlation coefficient. The cells are colored according to the magnitude of the correlations, ranging from dark red for positive correlations to dark blue for negative correlations. Abbreviations—alpha-fetoprotein (AFP), alanine aminotransferase (ALT), aspartate aminotransferase (AST), glypican-3 (GPC-3), hepatocellular carcinoma (HCC), protein induced by vitamin K absence or antagonist II (PIVKA-II).

