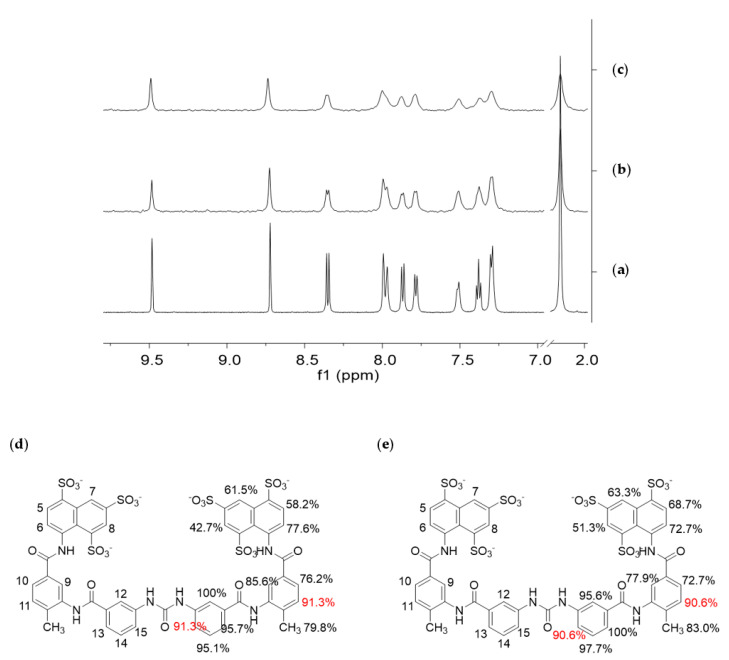
Figure 3.
Saturation-Transfer Difference (STD) Nuclear Magnetic Resonance (NMR) experiments on suramin–NF-Y complexes; (a) 1H-NMR spectrum of suramin 1 mM; (b) STD NMR spectrum of a mixture of suramin (1 mM) and NF-Yd (25 µm); (c) STD NMR spectrum of a mixture of suramin (1 mM) and NF-Yt (25 µm). All samples were dissolved in 10 mM Tris-DCl, 150 mM NaCl, pH 8, and analyzed at 25 °C and 600 MHz. The 1H-NMR spectra were recorded with 64 scans and the STD NMR spectra with 1024 scans and 3-s saturation times; (d) binding epitopes of suramin to NF-Yd, and (e) trimer obtained for 0.6-s saturation time. The largest relative STD intensity was scaled to 100%. Values are referred to half molecule and are intended duplicated symmetrically. Values in red refer to protons whose overlapping prevented the discrimination of their single contribution.

