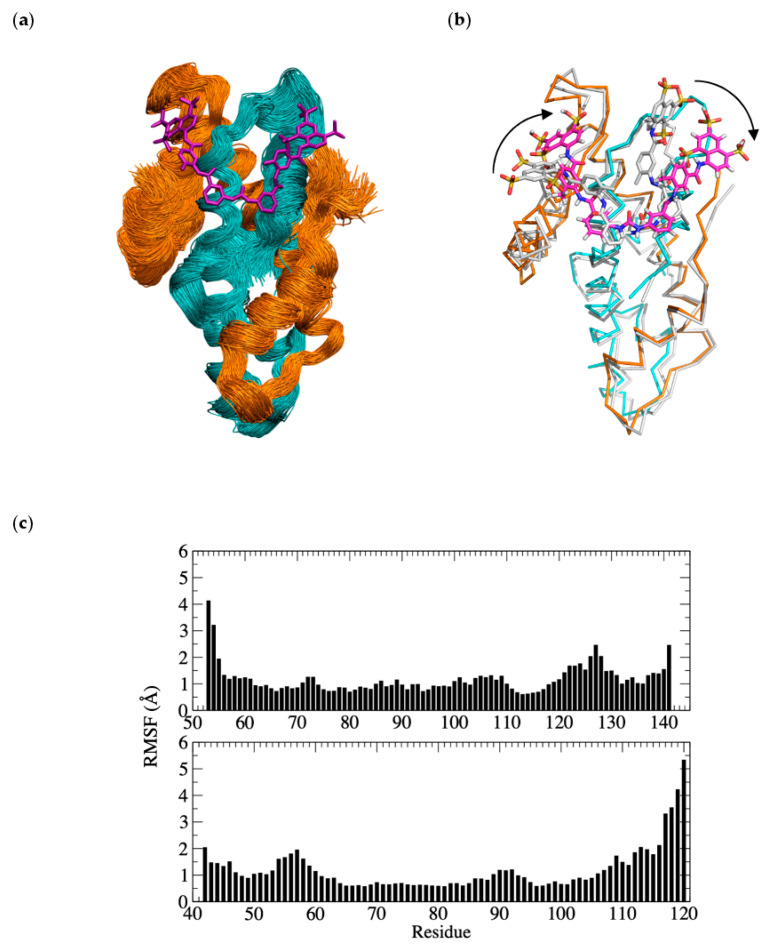
Figure 7.
Molecular dynamics (MD) simulations of the NF-Yd–suramin complex; (a) superimposed frames (one per ns) for the last µs of simulation (orange NF-YB, cyan NF-YC, and magenta suramin); (b) structural superposition of the middle structure of the most populated cluster of the MD simulations (color code as in panel (a) with the crystal structure of the complex (grey)). The readjustment of the two naphthalene rings to optimize the interactions with the single NF-Yd molecule are highlighted by arrows; (c) root mean square fluctuations (RMSF) per NF-YB and NF-YC residues (upper and lower panels, respectively).

