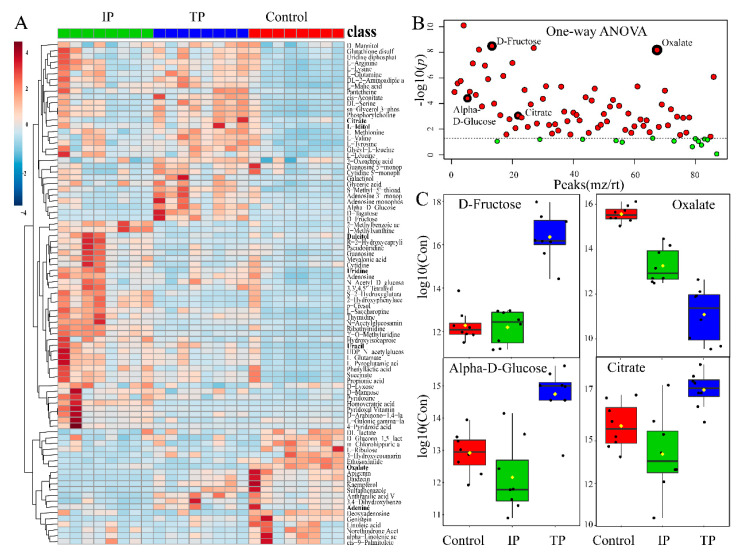
Figure 3.
Metabolic analysis in P. oxalicum with tricalcium phosphate (TP), iron phosphate (IP), and dipotassium phosphate (C) exposure. (A) Heat map visualization, hierarchical clustering analysis (HCA) provided intuitive visualization of all 73 identified metabolites with generalized logarithm transformation of concentration. Relative metabolite levels of three treatments were performed using an average clustering algorithm and Pearson’s correlation distance measure. (B) Important features selected by one-way ANOVA and Tukey’s HSD with p-value threshold 0.05 (Table S1). Data represent −log10 (raw p-value) changes. The dotted line represents the threshold p = 0.05. (C) Boxplot of 4 selected metabolomics features from the one-way ANOVA. The black dots represent the −log10(raw concentrations) from all the eight samples, and the notch indicates the 95% confidence interval around the median of each treatment. The mean concentration of each treatment is indicated with a yellow diamond.

