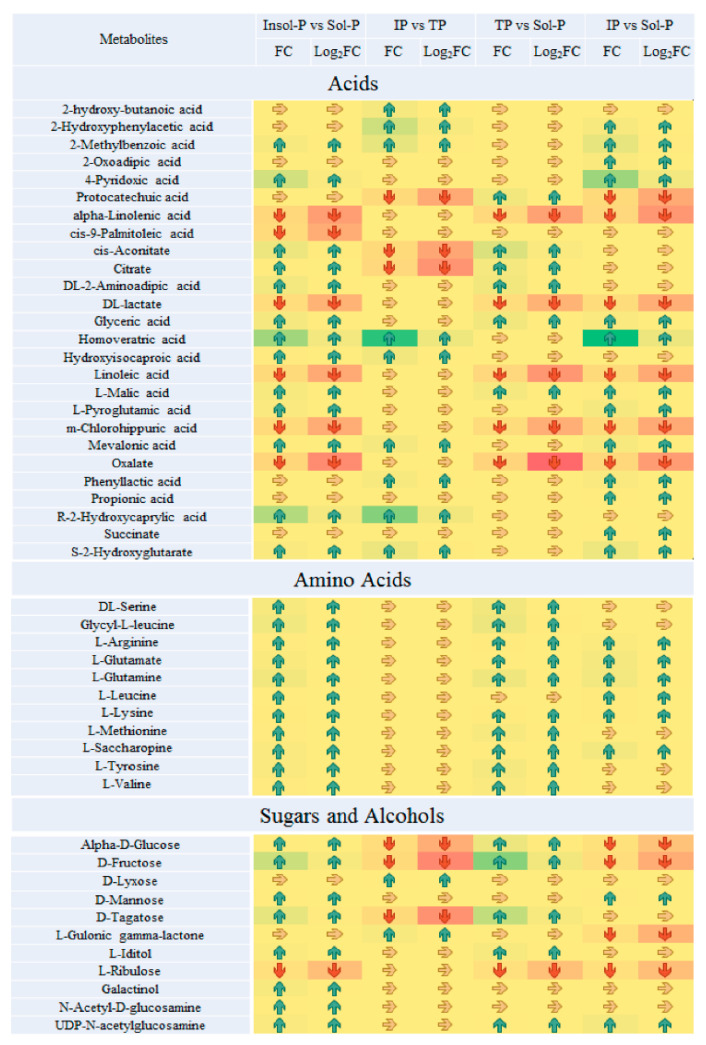
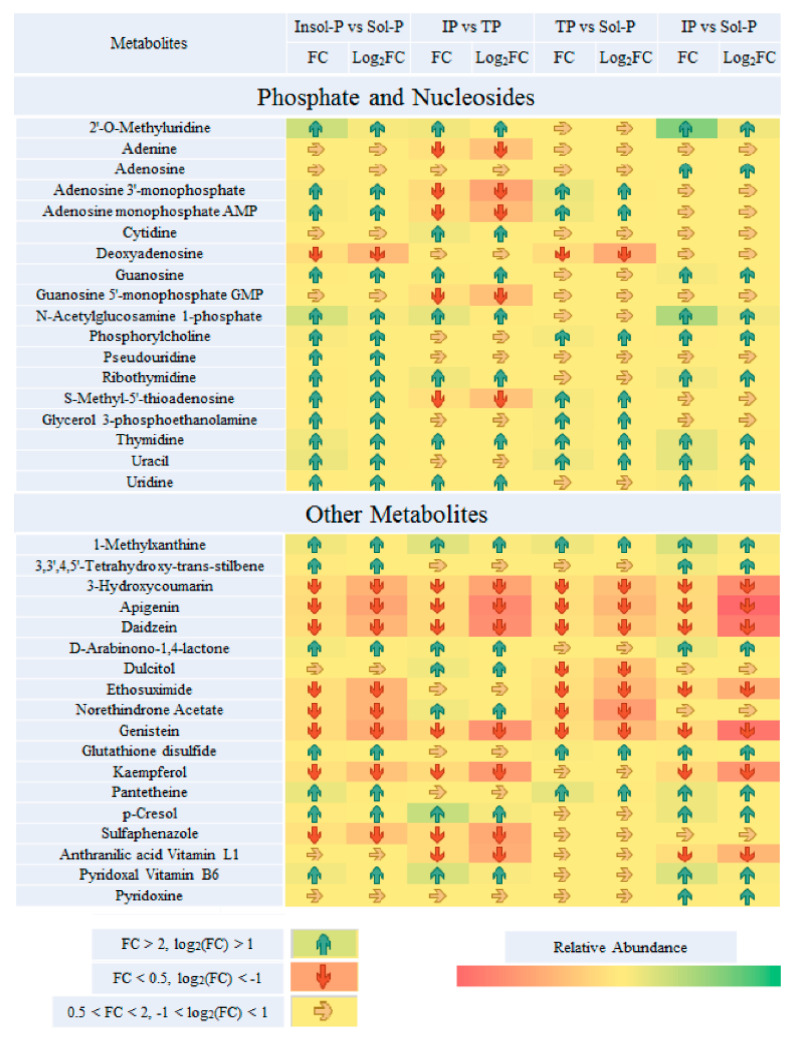
Figure 4.
Paired fold change analysis of Important metabolites that are affected by P sources (insoluble P (Insol-P) and soluble P (Sol-P), tricalcium phosphate (TP) vs. iron phosphate (IP), TP vs. Sol-P and IP vs. Sol-P). TP refers to the tricalcium phosphate group; IP refers to the iron phosphate group; Insol-P refers to insoluble P, including TP and IP groups; Sol-P refers to soluble P (dipotassium phosphate) group. Arrows of average fold changes (FC) and log2(FC) are listed and painted with increased coded “blue” (FC > 2, log2(FC) > 1) and decreases coded “red” (FC < 0.5, log2(FC) < −1) with significant changes (p < 0.05). The color of arrow listed “yellow” represent the undetected metabolites or metabolites with no significant FC values changes (0.5 < FC < 2, p < 0.05).


