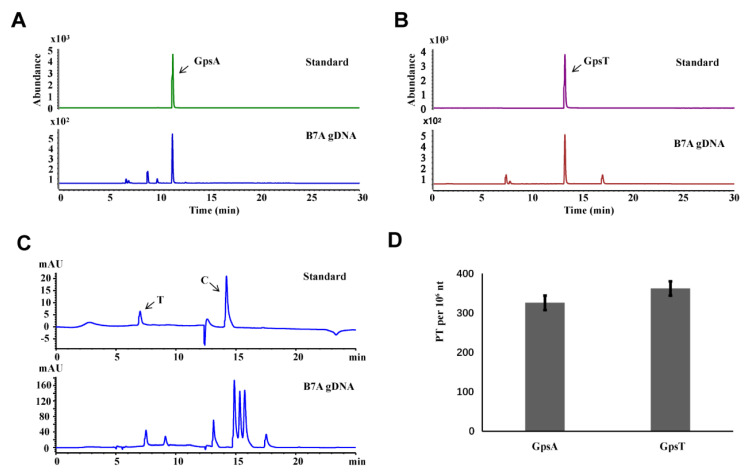
Figure 3.
Quantitative analysis of genomic PT modification by LC-MS/MS. (A,B) LC-MS/MS analysis of the PT-linked dinucleotides from E. coli B7A. (C) HPLC analysis of gDNA from E. coli B7A. (D) The number of PT-modified dinucleotides per 106 nt of DNA in E. coli B7A. Error bars are calculated as the s.d. of three independent biological replicates.

