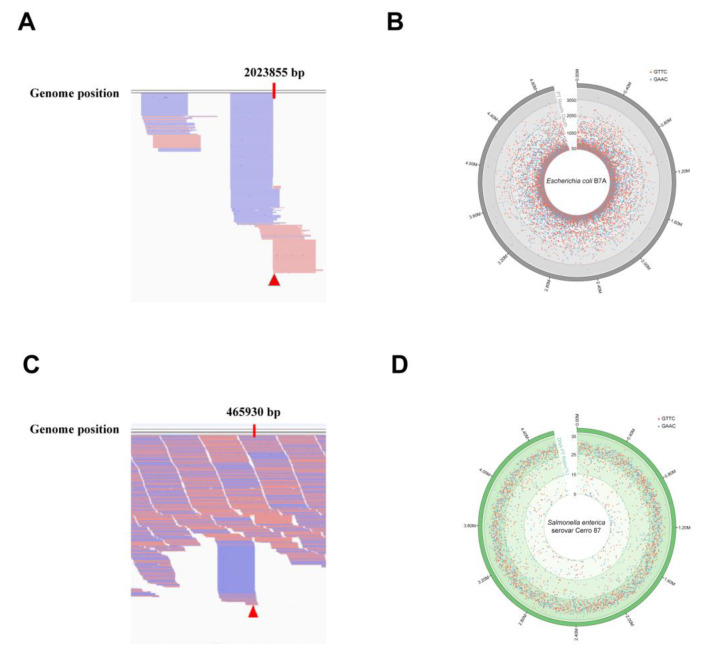
Figure 4.
Characterization of PT modifications on whole genomic landscapes by ICDS and PT-IC-Seq. (A) The snapshot of genome browser (IGV) representing partially modification sites in E. coli B7A genome. The top track shows counts of 5′ ends in the selected region. Blue segments represent reads mapped to reverse strand and red segments represent reads mapped to forward strand. The red triangle marks a PT sites in E. coli B7A genome. (B) Map of PT modification sites across the E. coli B7A genome. From inner to outer circles: 1 to 4 (reads value of modification sites with 50–1050, 1050–2050, 2050–3050, more than 3050): PT sites in GAAC (blue dots) and GTTC (red dots). The dot marks denote all occurrences of the GAAC/GTTC sequence across the genome, and the depth of reads ended at these locations see the Supplementary Table S1. (C) The snapshot of genome browser representing partially modification site in Salmonella enterica serovar Cerro 87 genome. The top track shows counts of 5′ ends in the selected region. Blue segments represent reads mapped to reverse strand and red segments represent reads mapped to forward strand. The red triangle marks a PT site in Salmonella enterica serovar Cerro 87 genome. (D) PT site mapping across the Salmonella enterica serovar Cerro 87 genome. From inner to outer circles: 1 to 3 (PT sites modified with 5–15%, 15–25%, 25–35%): PT sites in GAAC (blue dots) and GTTC (red dots). The dot marks denote all occurrences of the GAAC/GTTC sequence across the genome, and the PT ratios at each site see the Supplementary Table S2.

