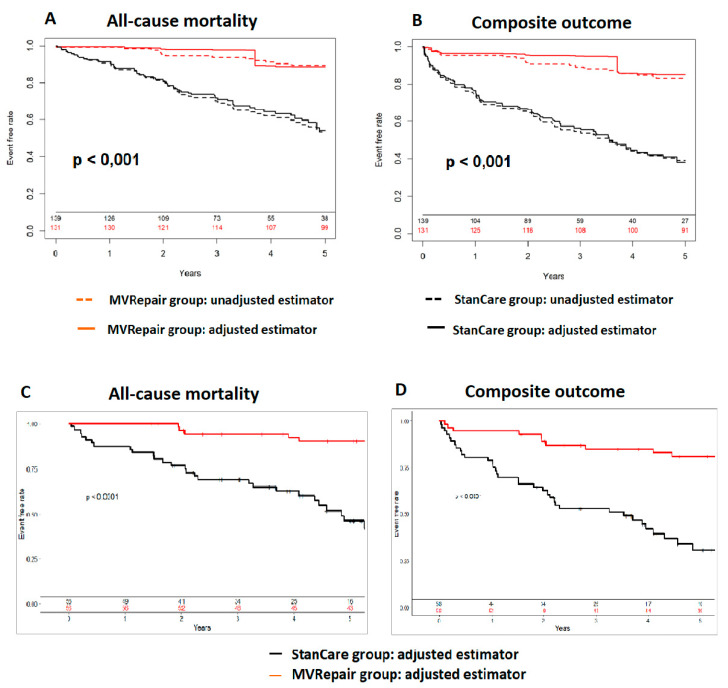
Figure 4.
Survival analysis using inverse probability weighting. All-cause mortality (A) and its composite with HFpEF readmissions (B) after propensity matching for baseline perioperative risk (EuroSCORE II, age, and HYHA class) at 5 years. Unadjusted (dashed lines) and adjusted (solid lines) in the MVRepair (red color) versus the StanCare (black color) groups. Propensity matching resulted in 52 matched pairs. All-cause mortality (C) and its composite with HFpEF readmissions (D) following propensity matching for relevant clinical characteristics (age, gender, NYHA class, body mass index, hypertension, diabetes mellitus, LV end-diastolic diameter, tricuspid regurgitation grade, and pulmonary artery pressure). The MVRepair group is shown in red, while the StanCare group is shown in black.

