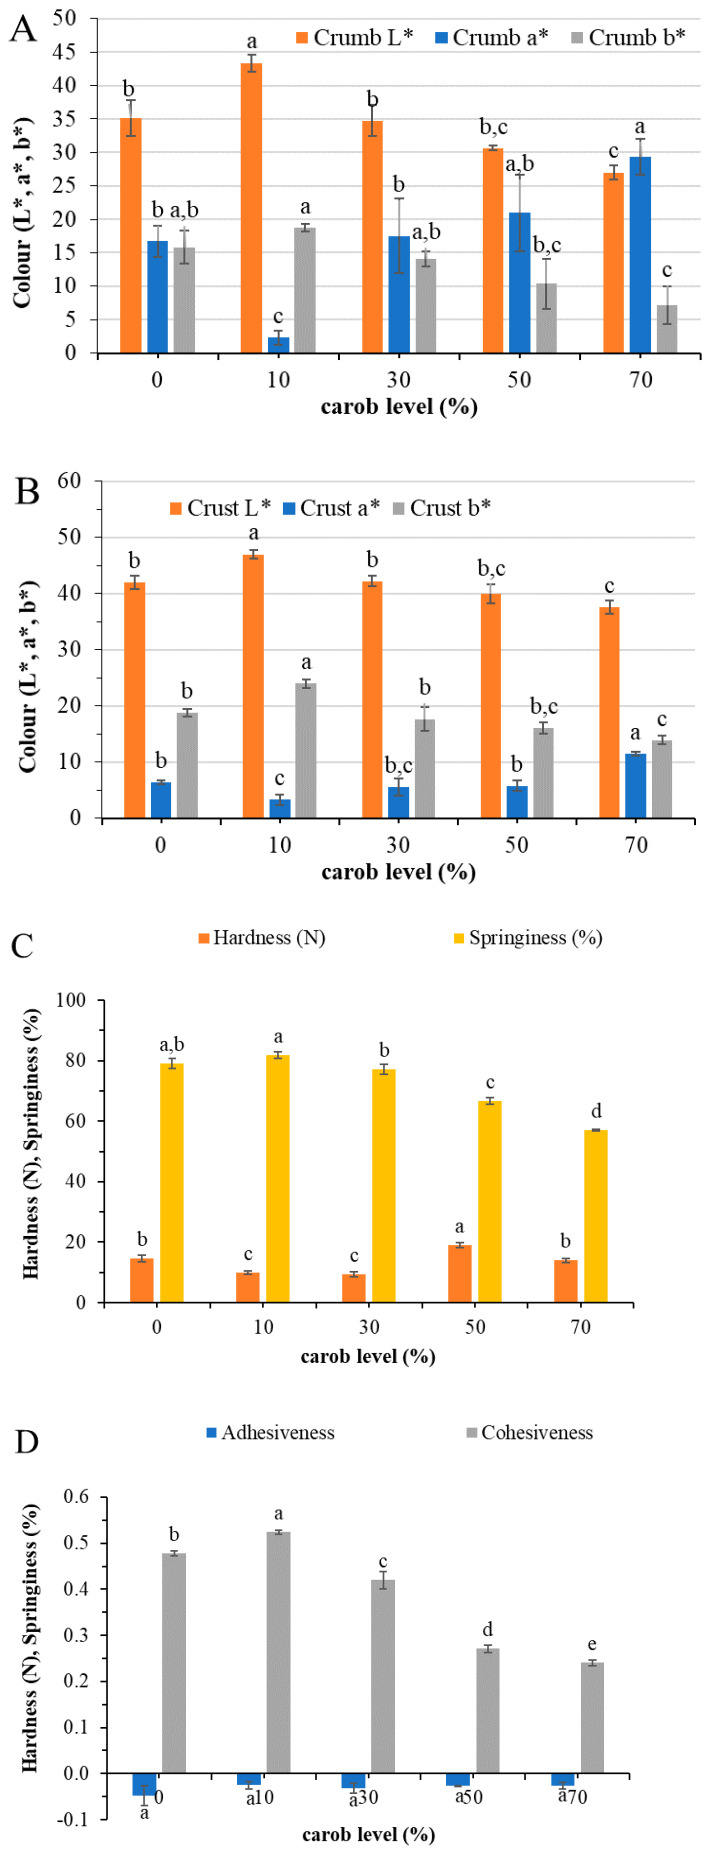
Figure 1.
Crumb (A) and crust (B) color, as well as texture parameters (C,D) of control cake ((0% carob, 15% cocoa (f.b.)) and carob cakes prepared with different levels of carob flour. Data represent means ± SD (n = 3). Means that do not share a letter are significantly different (p < 0.05) according to Tukey’s pairwise comparison of means.

