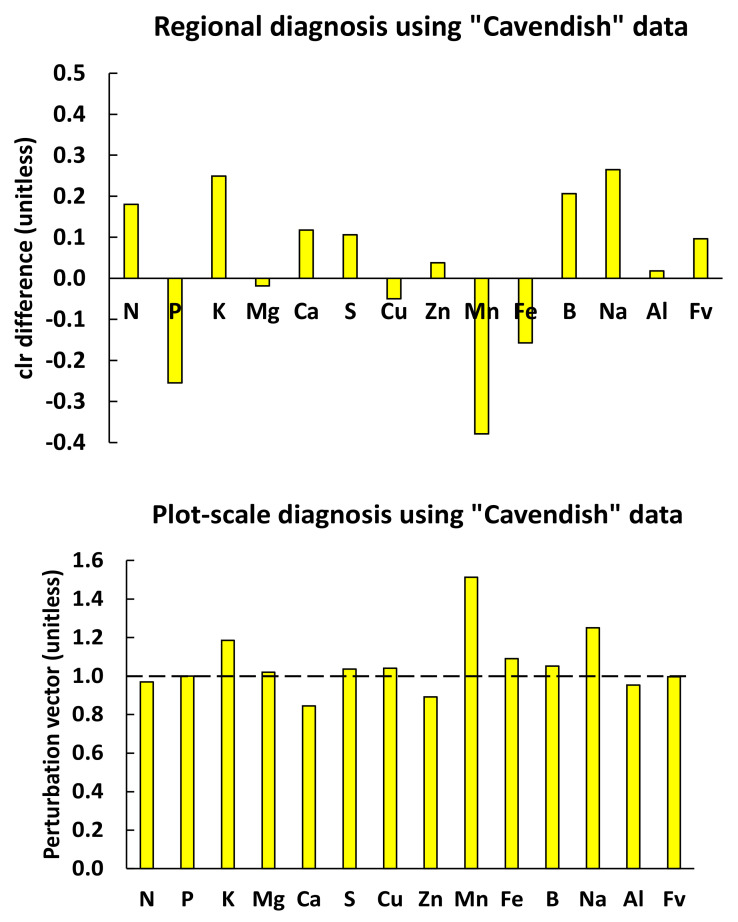
Figure 6.
Regional diagnosis of median “Cavendish” tissue nutrient concentrations in Table 3 using centered log ratio index (CLR index) compared to plot-scale diagnosis using the perturbation vector. If regional and local reference compositions are the same, the clr differences and the perturbation vector should return similar diagnoses, which is not totally the case here, especially for N, Mn and Ca.

