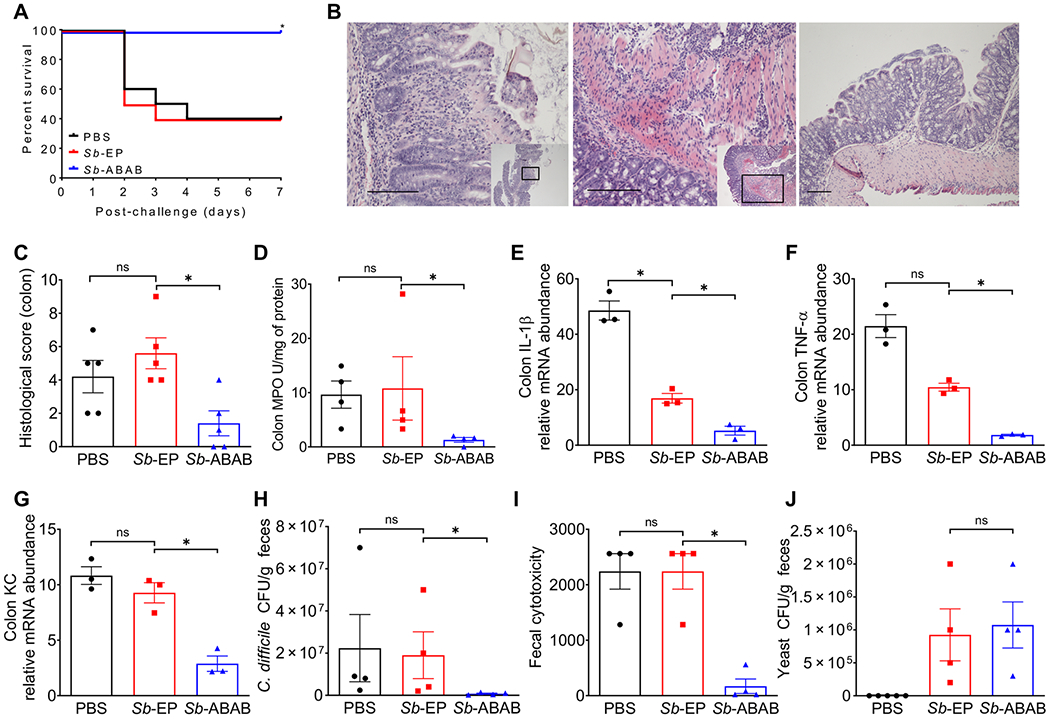
Fig. 3. Prophylactic efficacy of Sb-ABAB against CDI in mice.

Antibiotic cocktail–treated mice were given Sb-ABAB 3 days before C. difficile spore challenge. (A) Kaplan-Meier survival curves of mice treated with Sb-ABAB compared with controls treated with Sb-EP or PBS. (B) Hematoxylin and eosin (H&E)–stained colonic tissue sections. The insets show where in the tissue the magnified section is located. Left to right: Crypt loss in a representative section from the PBS-treated group (200×), neutrophil infiltration into serosa in a representative section from the Sb-EP–treated group (200×), and a representative tissue sectioning from the Sb-ABAB–treated group (100×). Scale bars, 100 μm. (C) Histological scores for H&E-stained colonic tissue sections. (D) Myeloperoxidase (MPO) assay as a measure of neutrophil infiltration. (E to G) mRNA expression of proinflammatory cytokines interleukin-1β (IL-1β), tumor necrosis factor–α (TNF-α), and cytokine-induced neutrophil-attracting chemokine (KC) in colonic tissues. (H) Fecal C. difficile count from challenged mice. (I) Fecal toxin titers from challenged mice. (J) Fecal S. boulardii CFU counts from prophylactically treated mice. All experimental data in this figure represent one of at least three separate experiments with 10 mice per group (A) or 4 mice per group (C to J) and are presented as means ± SEM. Statistical analysis was performed by comparing the indicated groups using a log-rank (Mantel-Cox) test (A) or a two-tailed Mann-Whitney test (C to J). *P < 0.05; ns, not significant.
